Canada’s Express Entry pool grew by over 2,100 profiles between March 15 and April 12—reversing a months-long downward trend despite Canada’s immigration department issuing nearly 14,000 Invitations to Apply (ITAs) during the same period.
The growth was concentrated in the 451–480 Comprehensive Ranking System (CRS) score range (+1,581 profiles), as well as the higher 501–600 score range (previously on a steady decline)—which grew by 571 profiles.
See how competitive your Express Entry profile is
That growing top-end competition was reflected in the most recent Canadian Experience Class (CEC) draw on April 14, which issued just 2,000 invitations—the smallest CEC draw of 2026—at a CRS cut-off of 515, six points higher than the previous draw.
What changes occurred in the Express Entry pool over the last four weeks?
Between March 15 (date of the previous pool update) and April 12, the Express Entry pool grew from 231,362 to 233,555 profiles—a net increase of 2,193. This marks the first time the pool has expanded rather than contracted since the start of February of this year.
The largest single gain came from the 461–470 CRS range, which added 696 profiles. Every 10-point bracket between 401 and 480 grew, with increases ranging from 390 to 696 profiles per band. Taken together, the 401–480 range accounted for a net gain of 3,895 profiles.
The 501–600 range, specifically, grew by 571 profiles—this is notable because this bracket had been shrinking consistently in previous updates due to regular CEC draws, suggesting a fast pace of new profiles entering the pool.
On the other hand, the 351–400 range saw the largest single decline at 1,256 profiles, likely driven by French-language proficiency draws—which this year, have targeted candidates with CRS scores as low as 393. The 481–490 and 491–500 score ranges also declined, losing 329 and 247 profiles, respectively.
Note: The pool composition data published on April 12 does not account for the three Express Entry draws that took place between April 13 and 15, through which a total of 6,324 ITAs were issued. This is discussed in further detail below.
In total, nine score ranges gained profiles, while the remaining six experienced declines:
| CRS score range | March 15 | April 12 | Difference |
|---|---|---|---|
| 0–300 | 8,299 | 8,253 | -46 |
| 301–350 | 18,903 | 18,543 | -360 |
| 351–400 | 53,565 | 52,309 | -1,256 |
| 401–410 | 11,437 | 11,845 | +408 |
| 411–420 | 12,288 | 12,753 | +465 |
| 421–430 | 12,471 | 12,973 | +502 |
| 431–440 | 14,247 | 14,775 | +528 |
| 441–450 | 14,195 | 14,606 | +411 |
| 451–460 | 15,122 | 15,512 | +390 |
| 461–470 | 15,272 | 15,968 | +696 |
| 471–480 | 15,751 | 16,246 | +495 |
| 481–490 | 12,992 | 12,663 | -329 |
| 491–500 | 13,421 | 13,174 | -247 |
| 501–600 | 13,039 | 13,610 | +571 |
| 601–1200 | 360 | 325 | -35 |
| Total | 231,362 | 233,555 | +2,193 |
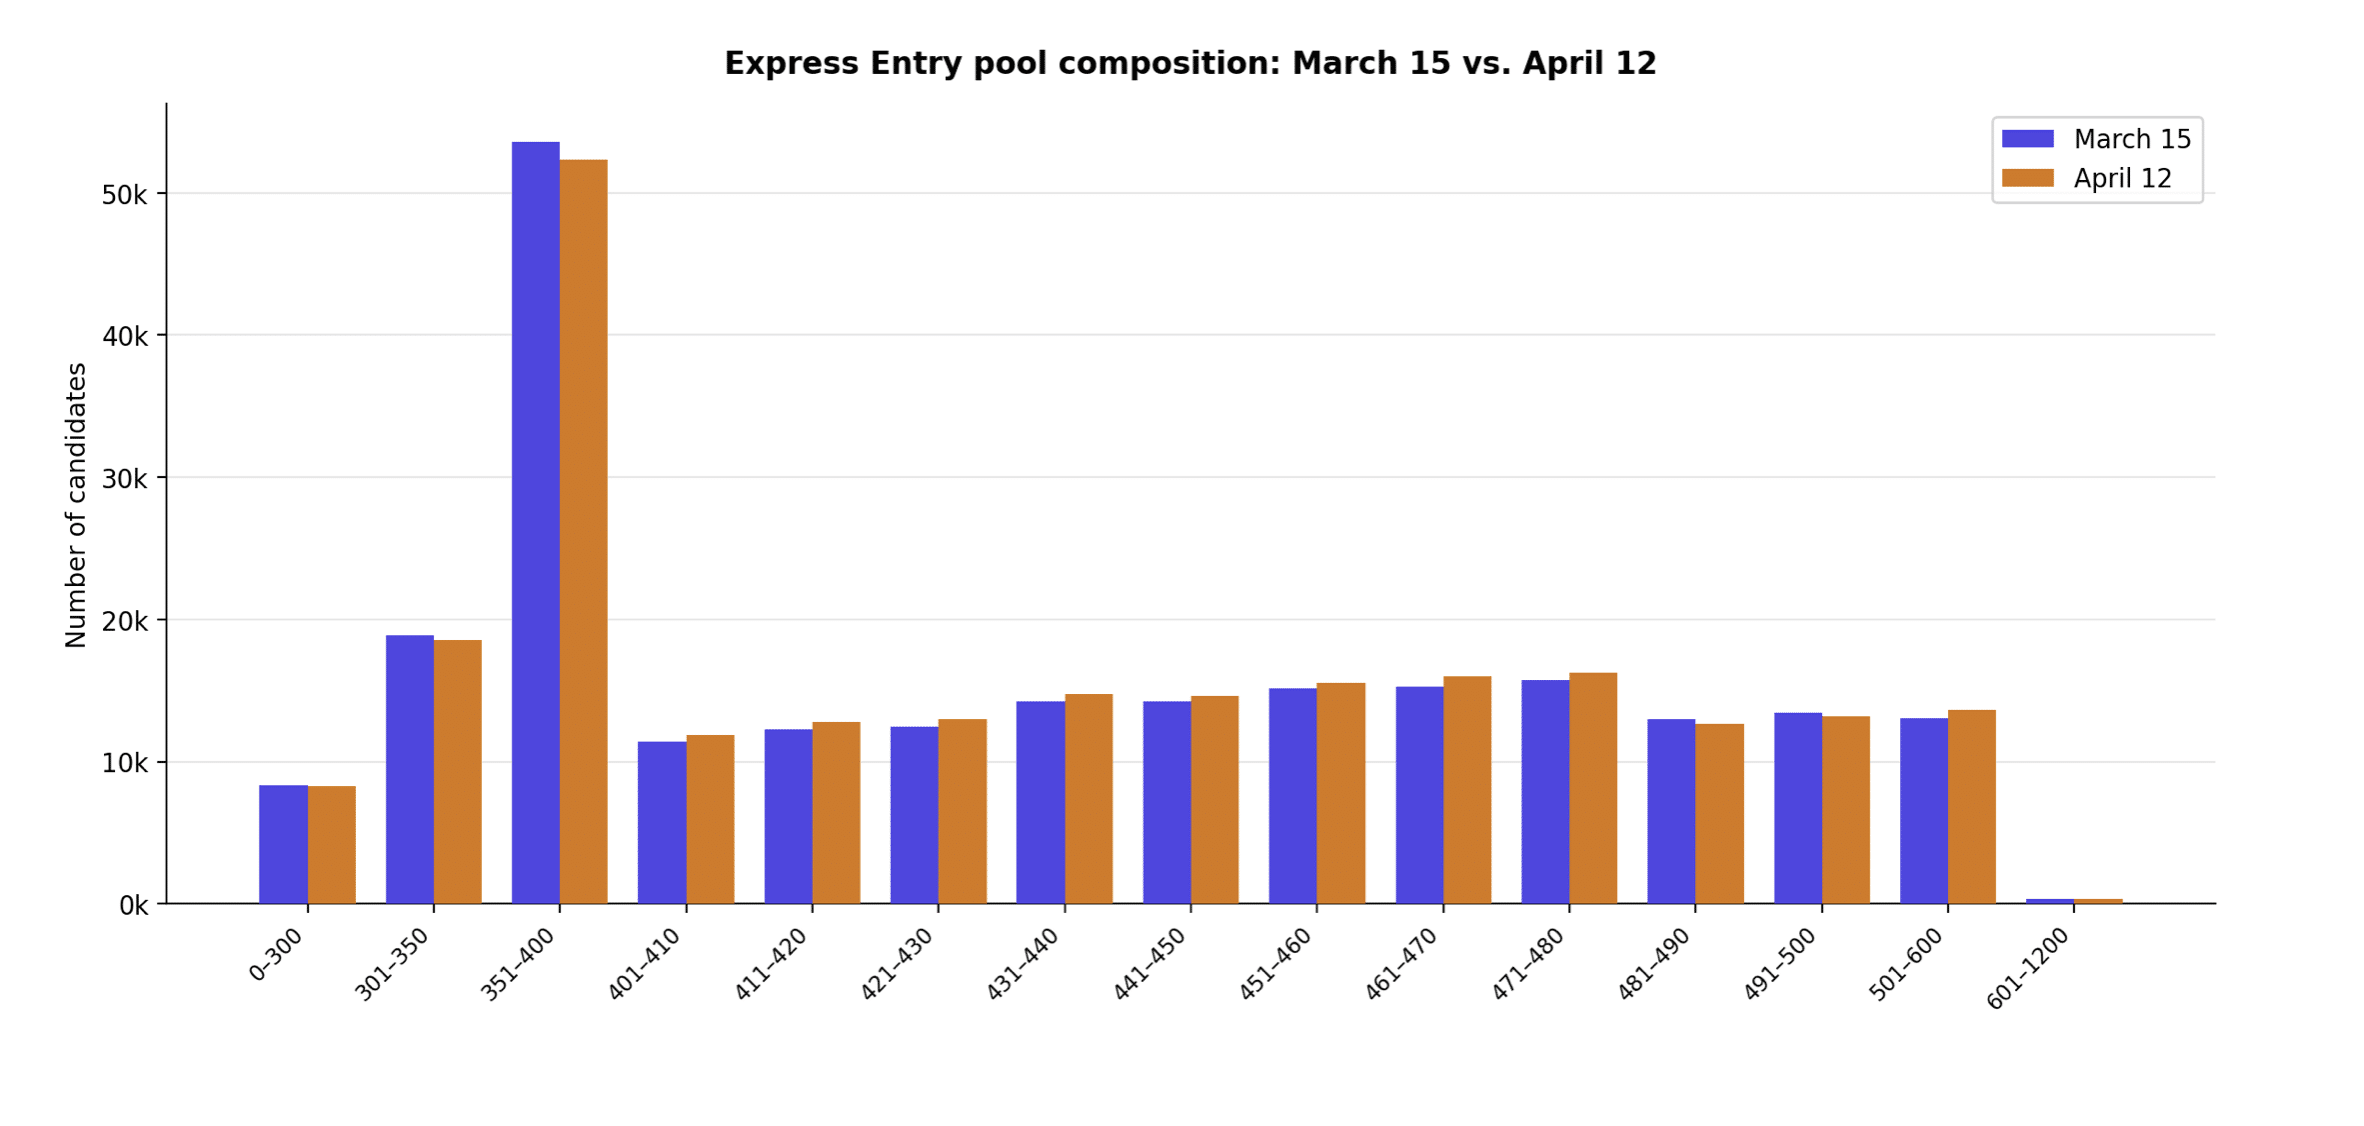
These distributions are compared in the chart below for easier visualization:
Which draws have not been accounted for in the April 12 distribution?
Immigration, Refugees and Citizenship Canada’s (IRCC’s) latest Express Entry data does not consider the three draws that occurred between April 13 and 15—totalling 6,324 ITAs:
| Date | Round type | Invitations issued | CRS score of lowest-ranked candidate invited |
|---|---|---|---|
| April 15 | French-Language proficiency | 4,000 | 419 |
| April 14 | Canadian Experience Class | 2,000 | 515 |
| April 13 | Provincial Nominee Program | 324 | 786 |
Based on these invitation results, these draws could correspond to significant changes in the candidate pool composition, to a minimum of:
- 4,000 fewer profiles between the 411–420 score range and above (French-language proficiency draw);
- 2,000 fewer profiles between the 501–600 score range and above (CEC draw); and
- 324 fewer profiles between the 601–1200 score range (PNP draw).
The CRS cut-off for CEC candidates rose to 515—up from 509 in the previous CEC draw on March 31—and the tie-breaking date of June 10, 2025, reached back more than ten months. This suggests a deep backlog of candidates at the 515 score level, and that IRCC may be issuing fewer invitations per CEC round than earlier in the year.
Coupled with the fact that the previous CEC draw (on March 31) also issued far fewer ITAs, a trend of smaller invitation issuances for this group is starting to emerge.
See how competitive your Express Entry profile is
What accounted for the changes in Express Entry profiles between March 15 and April 12?
Six Express Entry draws took place between March 15 and April 2, cumulatively issuing 13,968 ITAs across four different draw types:
| Date | Round type | Invitations issued | CRS score of lowest-ranked candidate invited |
|---|---|---|---|
| April 2 | Trades Occupations | 3,000 | 477 |
| March 31 | Canadian Experience Class | 2,250 | 509 |
| March 30 | Provincial Nominee Program | 356 | 802 |
| March 18 | French Language proficiency | 4,000 | 393 |
| March 17 | Canadian Experience Class | 4,000 | 507 |
| March 16 | Provincial Nominee Program | 362 | 742 |
Despite nearly 14,000 ITAs being issued (including in the first Trades category draw of the year) during this period, the pool still grew by 2,193 profiles. This indicates that approximately 16,000 new profiles entered the pool over the four-week period—outpacing the rate at which candidates were being removed through draws and profile expiries.
This represents a shift from recent reporting periods, where the pool had been contracting.
The influx of new mid-range profiles, particularly in the 401–480 bands, suggests that a growing number of candidates are entering the Express Entry system with Canadian work experience or other qualifications that place them in these score ranges.
How competitive is the Express Entry pool now?
The following table breaks down the competitiveness of the Express Entry pool, comparing the percentage makeup and the percentile scoring of candidates at the edges of each score range.
April 12 data is used to compute these scores:
| CRS score range | Number of candidates | Cumulative | Percentile range | Percentage |
|---|---|---|---|---|
| 0–300 | 8,253 | 8,253 | 0.00%–3.53% | 3.53% |
| 301–350 | 18,543 | 26,796 | 3.53%–11.47% | 7.94% |
| 351–400 | 52,309 | 79,105 | 11.47%–33.87% | 22.40% |
| 401–410 | 11,845 | 90,950 | 33.87%–38.94% | 5.07% |
| 411–420 | 12,753 | 103,703 | 38.94%–44.40% | 5.46% |
| 421–430 | 12,973 | 116,676 | 44.40%–49.96% | 5.55% |
| 431–440 | 14,775 | 131,451 | 49.96%–56.28% | 6.33% |
| 441–450 | 14,606 | 146,057 | 56.28%–62.54% | 6.25% |
| 451–460 | 15,512 | 161,569 | 62.54%–69.18% | 6.64% |
| 461–470 | 15,968 | 177,537 | 69.18%–76.02% | 6.84% |
| 471–480 | 16,246 | 193,783 | 76.02%–82.97% | 6.96% |
| 481–490 | 12,663 | 206,446 | 82.97%–88.39% | 5.42% |
| 491–500 | 13,174 | 219,620 | 88.39%–94.03% | 5.64% |
| 501–600 | 13,610 | 233,230 | 94.03%–99.86% | 5.83% |
| 601–1200 | 325 | 233,555 | 99.86%–100.00% | 0.14% |
See how competitive your Express Entry profile is