
IRCC releases updated distribution of candidate scores in the Express Entry pool

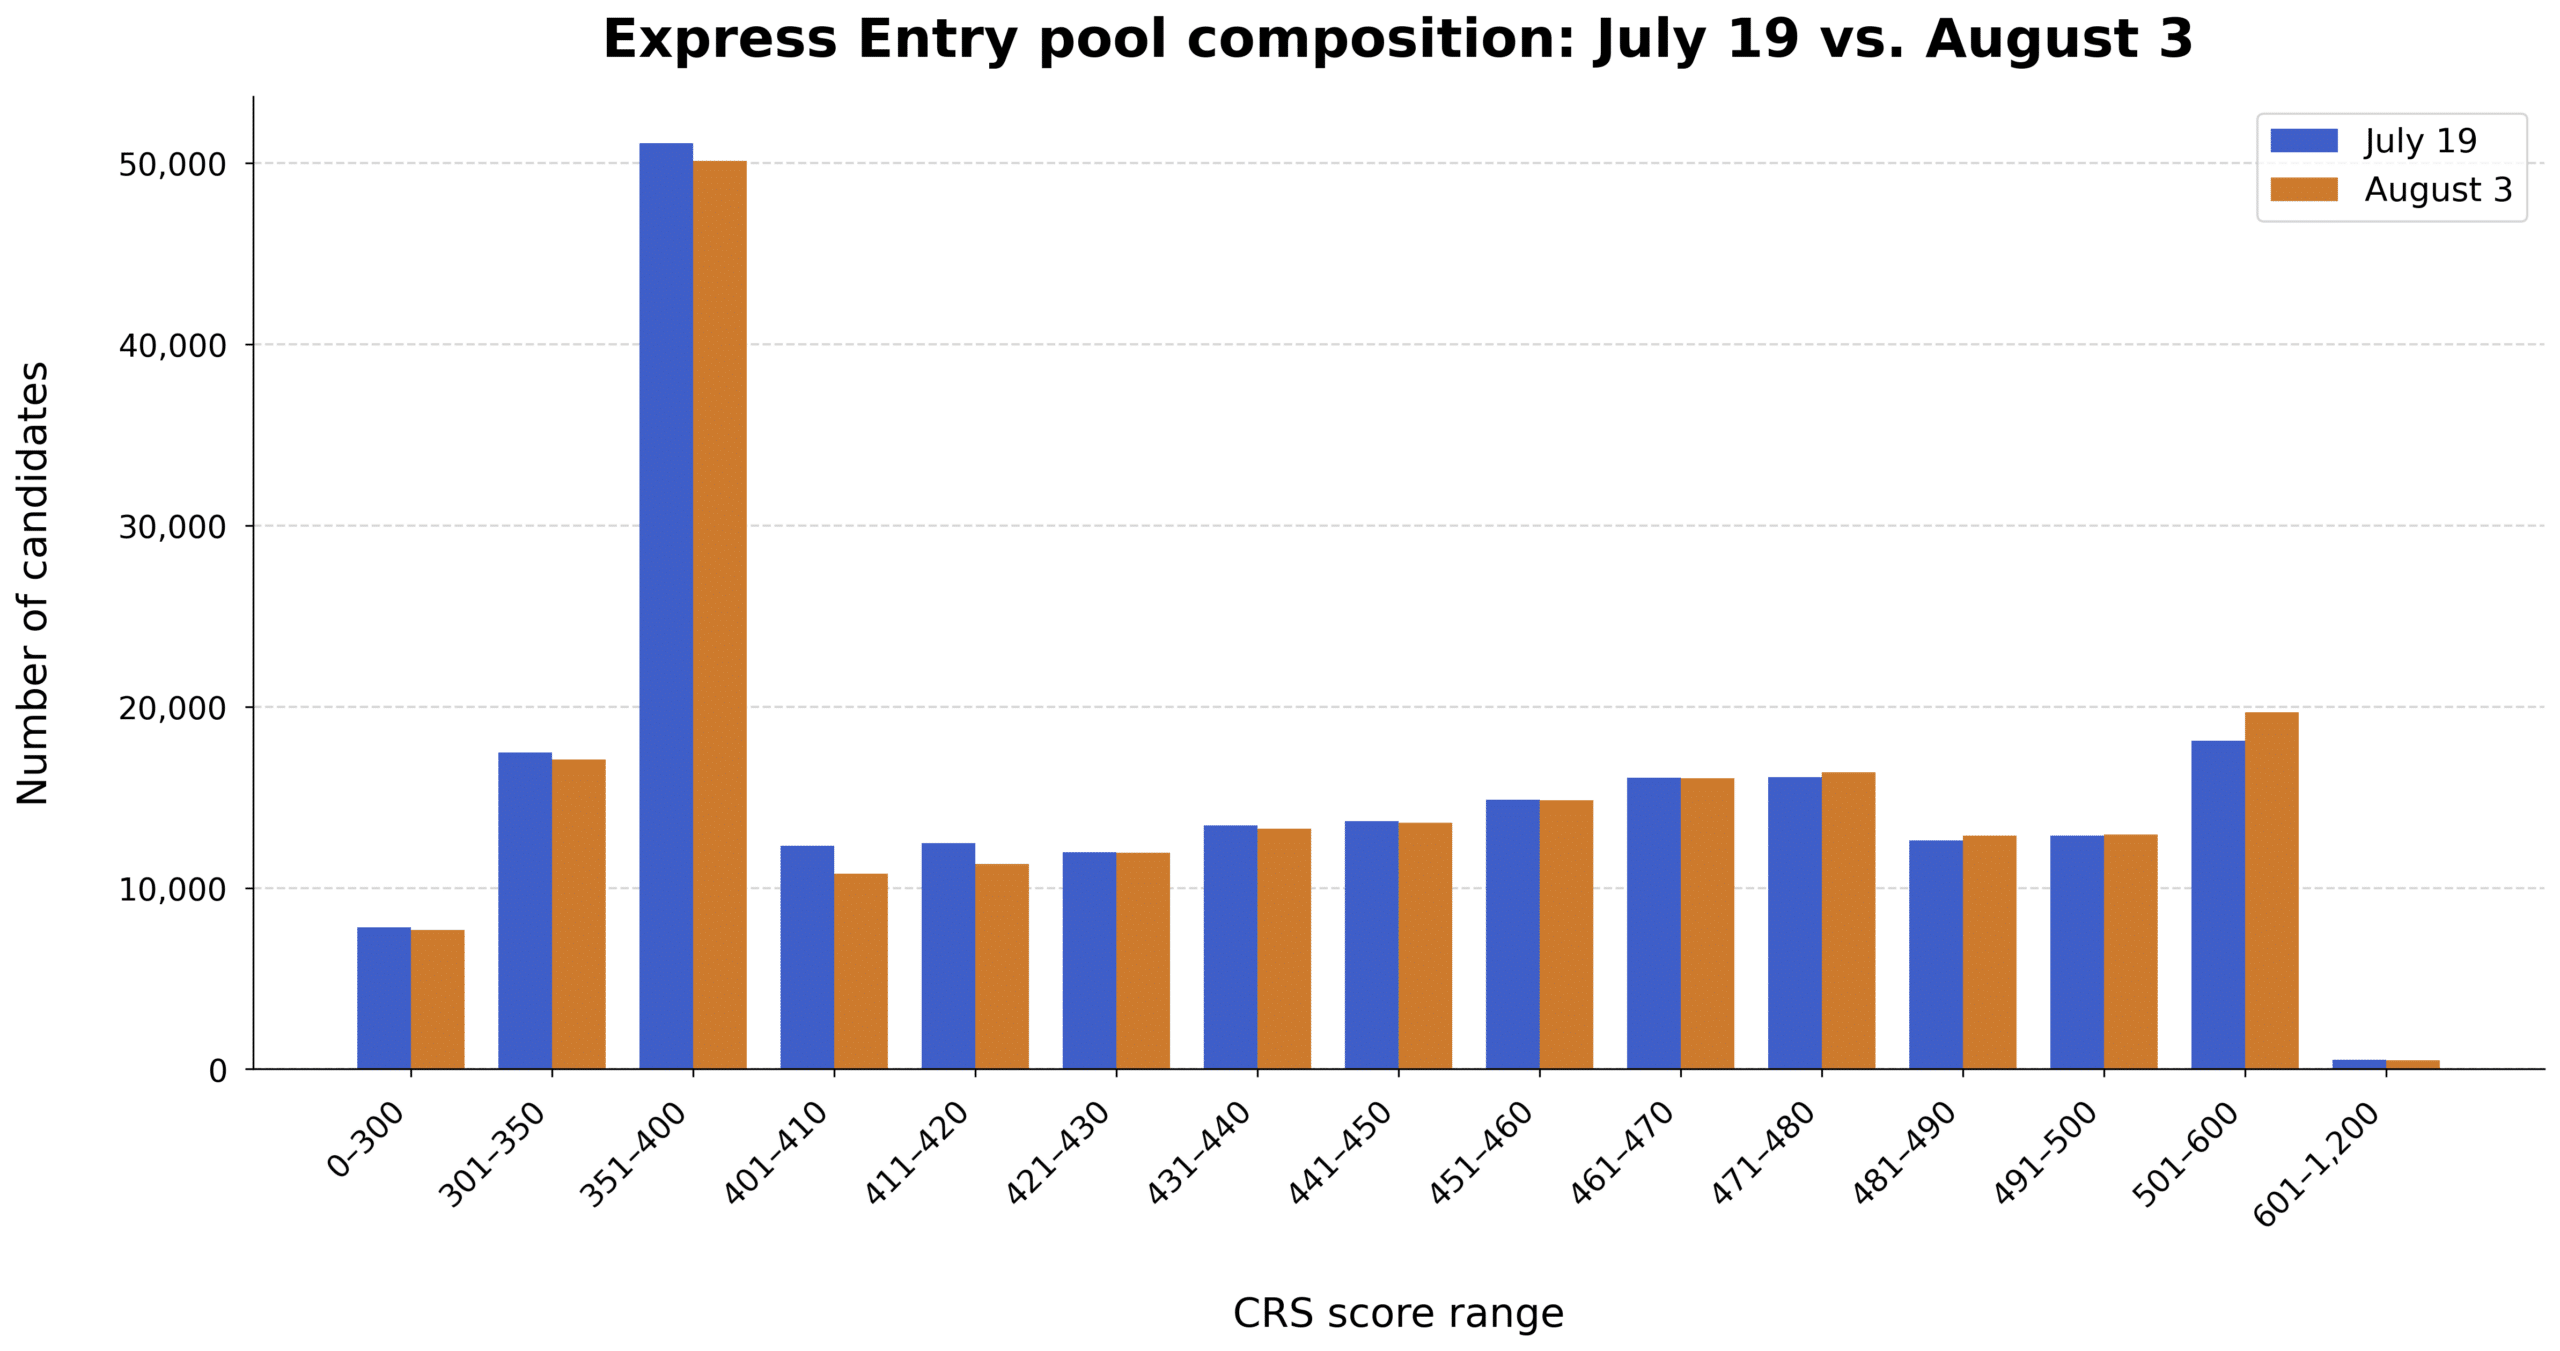
The Express Entry pool contracted by more than 2,400 profiles between July 19–August 3, despite an increase of over 1,500 candidates in the 501–600 CRS score range, according to the latest data provided by Canada’s immigration department.
Declines occurred across all ranges up to 470, while growth was recorded in almost every range above that level, except for the uppermost band.
See how competitive your Express Entry profile is
The following table provides a comparison of the Express Entry pool's composition as of August 3 against the prior update from July 19:
| CRS score range | August 3 | July 19 | Difference |
|---|---|---|---|
| 0–300 | 7,683 | 7,836 | −153 |
| 301–350 | 17,101 | 17,490 | −389 |
| 351–400 | 50,107 | 51,107 | −1,000 |
| 401–410 | 10,775 | 12,339 | −1,564 |
| 411–420 | 11,326 | 12,460 | −1,134 |
| 421–430 | 11,942 | 11,961 | −19 |
| 431–440 | 13,267 | 13,437 | −170 |
| 441–450 | 13,595 | 13,680 | −85 |
| 451–460 | 14,845 | 14,879 | −34 |
| 461–470 | 16,057 | 16,086 | −29 |
| 471–480 | 16,368 | 16,119 | +249 |
| 481–490 | 12,890 | 12,615 | +275 |
| 491–500 | 12,939 | 12,880 | +59 |
| 501–600 | 19,705 | 18,133 | +1,572 |
| 601–1,200 | 500 | 511 | −11 |
| Total | 229,100 | 231,533 | −2,433 |
This information is also provided in graph form below:
How competitive is the Express Entry pool as of the latest data?
The following table shows the proportion of candidates within each Comprehensive Ranking System (CRS) score range and the percentile ranges associated with the lower and upper limits of each range, providing insight into the competitiveness of the Express Entry pool.
The calculations are based on the Express Entry pool as of August 3.
| CRS score range | Number of candidates | Cumulative | Percentile range | Percentage |
|---|---|---|---|---|
| 0–300 | 7,683 | 7,683 | 0.00%–3.35% | 3.35% |
| 301–350 | 17,101 | 24,784 | 3.35%–10.82% | 7.46% |
| 351–400 | 50,107 | 74,891 | 10.82%–32.69% | 21.87% |
| 401–410 | 10,775 | 85,666 | 32.69%–37.39% | 4.70% |
| 411–420 | 11,326 | 96,992 | 37.39%–42.34% | 4.94% |
| 421–430 | 11,942 | 108,934 | 42.34%–47.55% | 5.21% |
| 431–440 | 13,267 | 122,201 | 47.55%–53.34% | 5.79% |
| 441–450 | 13,595 | 135,796 | 53.34%–59.27% | 5.93% |
| 451–460 | 14,845 | 150,641 | 59.27%–65.75% | 6.48% |
| 461–470 | 16,057 | 166,698 | 65.75%–72.76% | 7.01% |
| 471–480 | 16,368 | 183,066 | 72.76%–79.91% | 7.14% |
| 481–490 | 12,890 | 195,956 | 79.91%–85.53% | 5.63% |
| 491–500 | 12,939 | 208,895 | 85.53%–91.18% | 5.65% |
| 501–600 | 19,705 | 228,600 | 91.18%–99.78% | 8.60% |
| 601–1,200 | 500 | 229,100 | 99.78%–100.00% | 0.22% |
The percentiles show what proportion of candidates in the pool have CRS scores equal to or below the upper limit of each score band.
They are shown as ranges to reflect that candidates within each CRS score range may fall between the two stated values.
Which draws have not been accounted for in the August 3 distribution?
The August 3 snapshot does not account for two later selection rounds held on August 4 and 5, which collectively produced 3,507 invitations:
| Date of draw | Round type | Invitations issued | CRS score of lowest-ranked candidate |
|---|---|---|---|
| August 4 | Provincial Nominee Program | 507 | 768 |
| August 5 | Canadian Experience Class | 3,000 | 516 |
As of these draws (the latest held by the immigration department), there have been a total of 108,123 invitations to apply for permanent residence issued through the Express Entry system.
What accounted for the changes in Express Entry profiles between July 19 and August 3?
Between July 19 and August 3, Immigration, Refugees and Citizenship Canada (IRCC) carried out four Express Entry selection rounds, collectively issuing 7,515 invitations.
The selection activity included a landmark draw on July 23: IRCC’s first-ever round targeting Skilled Military Recruits since introducing the category in February of this year.
| Date of draw | Round type | Invitations issued | CRS score of lowest-ranked candidate invited |
|---|---|---|---|
| July 20 | Provincial Nominee Program | 511 | 744 |
| July 21 | Canadian Experience Class | 2,000 | 516 |
| July 22 | French-Language proficiency | 5,000 | 399 |
| July 23 | Skilled Military Recruits | 4 | 368 |
During this period, the total number of candidate profiles in the Express Entry pool fell by 2,433.
Pursuing permanent residence through Express Entry
Express Entry is the federal government's principal application management system for economic immigration candidates seeking permanent residence and intending to settle outside Quebec.
Candidates must first meet the eligibility requirements of at least one of the following federal programs to enter the Express Entry pool:
- The Canadian Experience Class (CEC);
- The Federal Skilled Worker Program (FSWP); or
- The Federal Skilled Trades Program (FSTP).
Each profile is assigned a CRS score, influenced by factors such as age, education, official language proficiency, and work experience.
IRCC periodically holds invitation rounds, selecting the highest-scoring candidates to apply for permanent residence.
IRCC also uses category-based selection to invite candidates with specific attributes tied to economic priorities; these draws typically carry much lower CRS cutoffs than other draw types.
Ten such categories exist today, including French-language proficiency and occupational categories such as healthcare and social services, trades, STEM, education, and transport.
To illustrate, healthcare and social services draws held this year have recorded CRS cutoffs of 462–476, compared with 507–518 for CEC draws.
Some categories, such as Physicians with Canadian Work Experience and Skilled Military Recruits, serve a very specific niche—and typically see fewer invitations issued (e.g., the most recent Physicians draw invited just 271 people, compared to thousands for healthcare and social services or CEC draws).
Selection from the Express Entry pool triggers a 60-day deadline for submitting a permanent residence application.
Express Entry applications have historically taken about six months to process. Meanwhile, applications submitted through the base PNP have taken between 12–20 months to process over the past year or so.
Successful applicants receive a confirmation of permanent residence (COPR) from the federal government and may then complete the landing process in Canada to receive permanent residence.
- Do you need Canadian immigration assistance? Contact the Contact Cohen Immigration Law firm by completing our form
- Send us your feedback or your non-legal assistance questions by emailing us at media@canadavisa.com