
The state of the Express Entry pool: April 2024

April has seen more Express Entry draws, as immigration continues throughout the year.
Last month mirrored March in terms of draw types and sizes, with potential patterns emerging for 2024. Read on to learn what the current state of the Express Entry candidate pool is, what draws occurred in April, and how this can impact your immigration chances.
Get a Free Express Entry Assessment
The current state of the Express Entry pool
What draws occurred in April?
Similar to March, April saw four Express Entry draws: two general draws and two category-based selections.
General draws occurred on April 10th and 23rd, with CRS cut-offs of 549 and 524 respectively. Category-based selections (which target candidates with specific work experience or language proficiency) occurred on April 11th and 24th, inviting candidates with experience in STEM related professions, and French language proficiency.
Overall Comprehensive Ranking System (CRS) scores for general draws remain elevated, when compared to previous years. Every month this year (so far) has seen between three to five draws, with a roughly even split between general and category-based draws cumulatively.
| Draw Date | Round Type | Invitations Issued | CRS Score Cut-Off |
|---|---|---|---|
| 10-04-24 | General | 1,280 | 549 |
| 11-04-24 | STEM occupations | 4,500 | 491 |
| 23-04-24 | General | 2,095 | 529 |
| 24-04-24 | French language proficiency | 1,400 | 410 |
According to the immigration levels plan, Immigration Refugees and Citizenship Canada (IRCC) will allocate 110,770 invitations to apply (ITAs) for permanent residence (PR) via through the Express Entry system this year. As of April, 35,970 of these ITAs have been issued.
The Express Entry pool
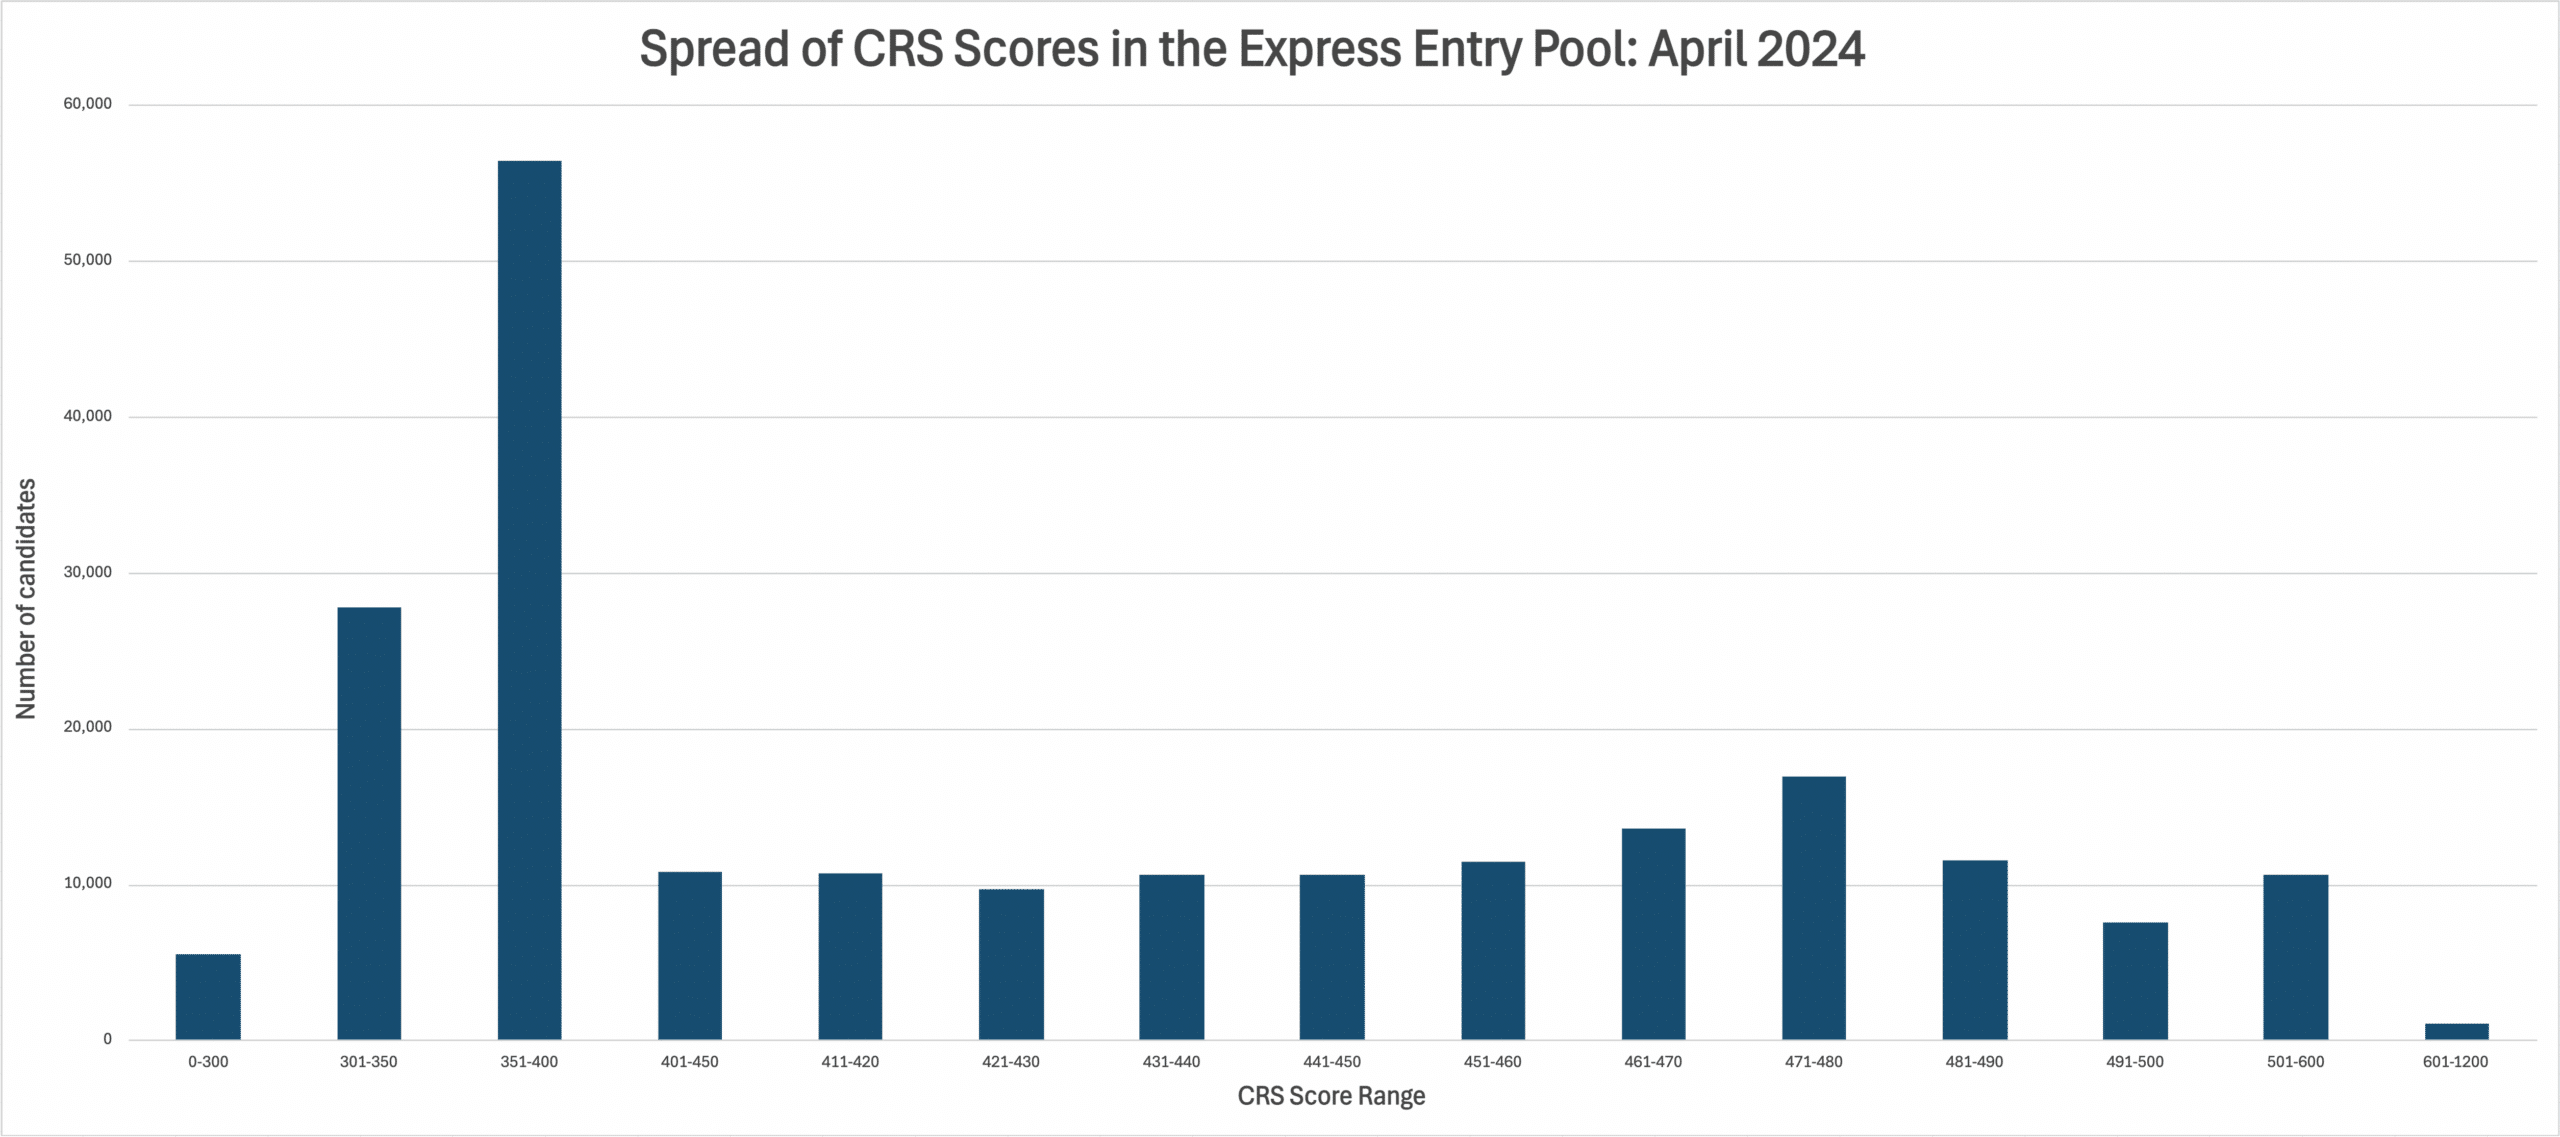
As of April 23rd, 2024, there are 214,697 candidate profiles within the Express Entry pool—marking an increase of 2753 profiles from March. Increases were seen across all score brackets at a roughly even rate, maintaining distributions at approximately the same volume as the previous month.
A complete table of score distributions and number of people in the pool can be found below.
| Score Range | Number of Candidates |
|---|---|
| 0-300 | 5,484 |
| 301-350 | 27,740 |
| 351-400 | 56,383 |
| 401-410 | 10,799 |
| 411-420 | 10,740 |
| 421-430 | 9,645 |
| 431-440 | 10,645 |
| 441-450 | 10,646 |
| 451-460 | 11,432 |
| 461-470 | 13,558 |
| 471-480 | 16,928 |
| 481-490 | 11,495 |
| 491-500 | 7,520 |
| 501-600 | 10,625 |
| 601-1200 | 1,057 |
These scores have also been visualised in a bar graph format to better understand the distribution. As we can see the most populous score range (with the most candidates) continues to be the 351-400 CRS boundary.
What percentile is your score in the pool?
Taking the upper bound of each score range we can calculate the percentile of that score relative to the overall pool. The percentile can help us better understand how scores compare to each other, and what percentage of the pool is below that score. While having a score with a higher percentile may not guarantee an ITA, it can still provide some indication as to how one’s immigration chances may be throughout the year.
Find the complete breakdown of score percentiles below:
| Score Ranges | Number of Candidates | Percentile (%) |
|---|---|---|
| 0-300 | 5,484 | 2.55 |
| 301-350 | 27,740 | 15.47 |
| 351-400 | 56,383 | 41.74 |
| 401-410 | 10,799 | 46.77 |
| 411-420 | 10,740 | 51.77 |
| 421-430 | 9,645 | 56.26 |
| 431-440 | 10,645 | 61.22 |
| 441-450 | 10,646 | 66.18 |
| 451-460 | 11,432 | 71.50 |
| 461-470 | 13,558 | 77.82 |
| 471-480 | 16,928 | 85.70 |
| 481-490 | 11,495 | 91.06 |
| 491-500 | 7,520 | 94.56 |
| 501-600 | 10,625 | 99.51 |
| 601-1200 | 1,057 | 100.00 |
How does the composition of the Express Entry candidate pool influence score cut-offs and draw sizes?
Predicting upcoming CRS score cut-offs and draw sizes can be very difficult (if not impossible) due to the multitude of considerations that IRCC takes before conducting each draw (such as category-based selections, which respond to demographic and labour market needs in Canada and put less emphasis on CRS scores).
However, understanding the spread of these scores, and the size of the pool overall (especially in context of yearly immigration levels) can help us understand the trends that may impact draw sizes and cut-off scores. This is because not only does IRCC likely consider the spread of CRS scores when determining what the next cut-off score should be; but also, because all draw sizes must eventually work towards meeting the departments targets and outlined in the immigration levels plan.
Thus, while the information above cannot help us predict the future with total accuracy, understanding the trends within and behind the Express Entry pool can still be valuable in evaluating an applicant’s chances of receiving an ITA this year.
- Do you need Canadian immigration assistance? Contact the Contact Cohen Immigration Law firm by completing our form
- Send us your feedback or your non-legal assistance questions by emailing us at media@canadavisa.com