Number of top-scoring Express Entry profiles increases
From August 17 to September 28, the number of top-scoring Express Entry profiles rose, even as the total number of profiles in the pool fell by 3,120.
The 501–600 score range increased by 1,601 profiles, and the 601–1,200 range increased by 100 profiles, making the pool more competitive.
See how competitive your Express Entry profile is
This article will cover
- The current composition of the Express Entry pool;
- How your CRS score compares to other candidates in the pool; and
- The Express Entry draws conducted in September.
What is the current distribution of scores in the Express Entry pool?
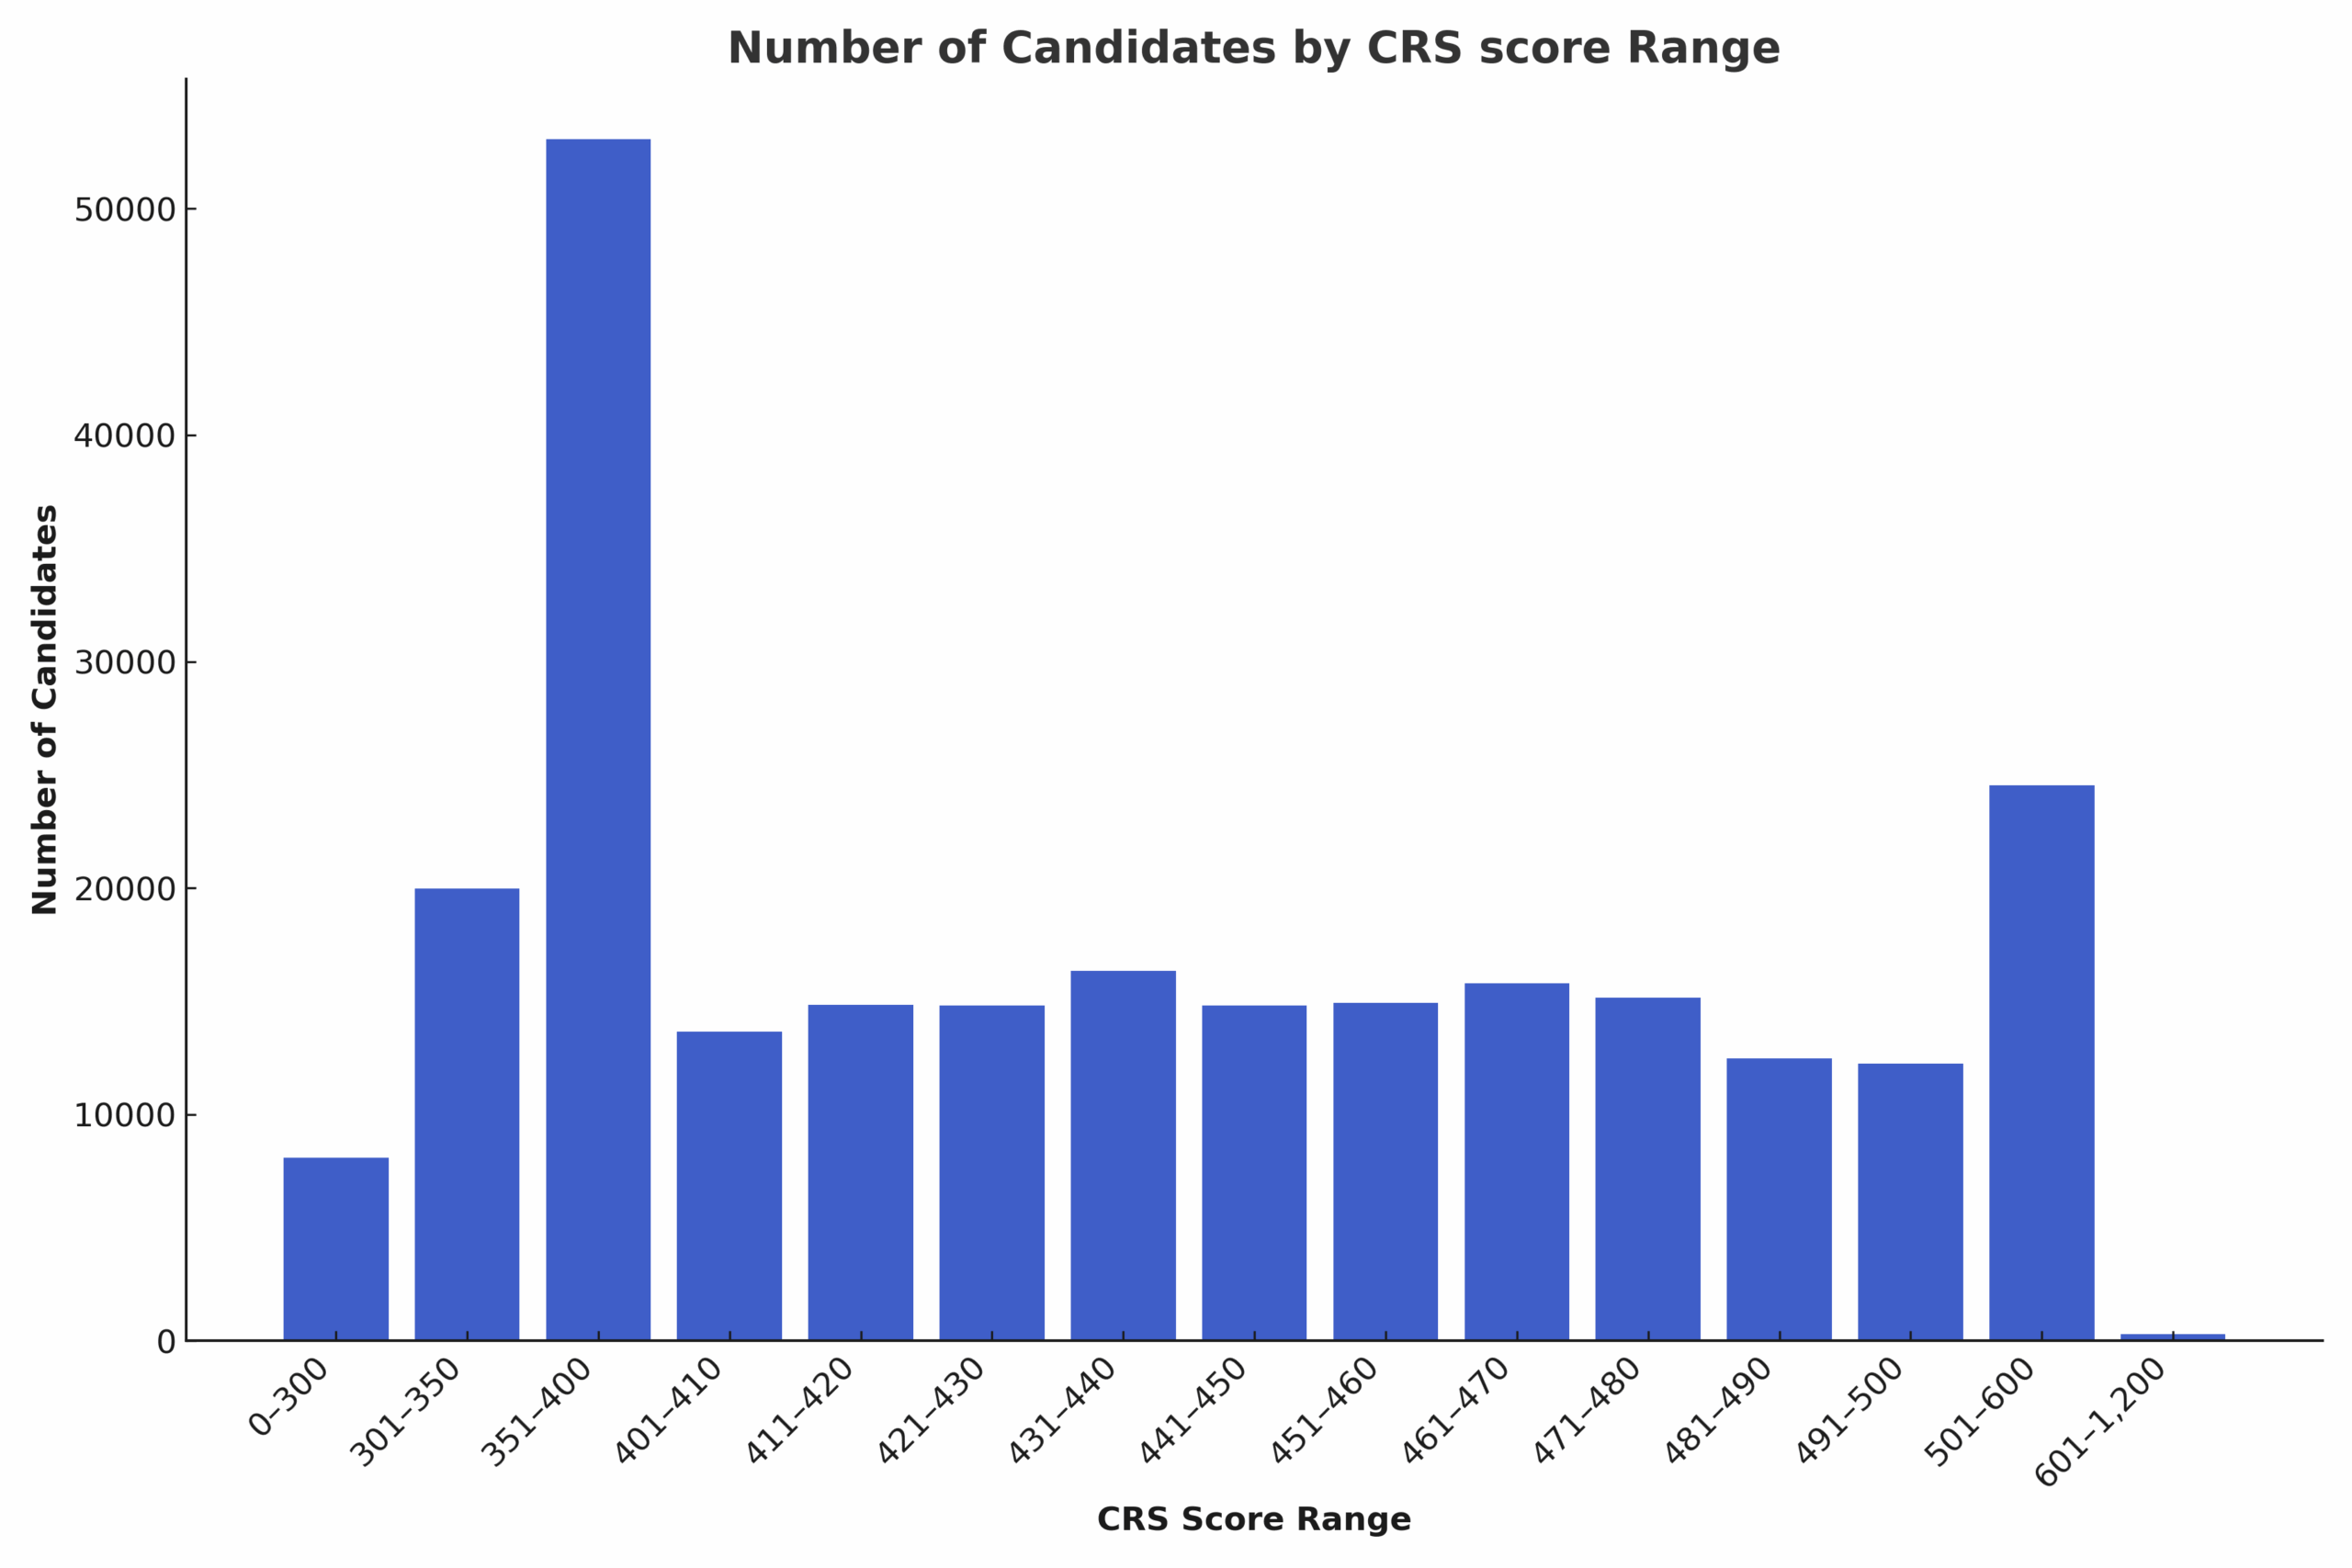
The table below highlights both the current score distribution of Express Entry profiles as of September 28, and the changes observed across each score band since August 17.
| CRS score range | Number of candidates | Change in number of profiles |
|---|---|---|
| 0–300 | 8,081 | −98 |
| 301–350 | 19,963 | -461 |
| 351–400 | 53,066 | −395 |
| 401–410 | 13,662 | +207 |
| 411–420 | 14,839 | +351 |
| 421–430 | 14,820 | +181 |
| 431–440 | 16,354 | +132 |
| 441–450 | 14,806 | −310 |
| 451-460 | 14,924 | −955 |
| 461–470 | 15,781 | −1,558 |
| 471–480 | 15,150 | −1,885 |
| 481–490 | 12,473 | +124 |
| 491–500 | 12,255 | −154 |
| 501–600 | 24,531 | +1,601 |
| 601–1,200 | 288 | +100 |
| Total | 250,993 | -3,120 |
See how competitive your Express Entry profile is
Overall, the Express Entry pool saw a decline of more than 3,100 candidate profiles since August 17, with the most significant drop occurring in the 451 to 480 score range.
How do the scores in the Express Entry pool rank against each other?
The following table outlines how CRS scores were distributed in the Express Entry pool as of September 28, 2025.
Percentile ranges are provided for all score bands, along with the percentage of candidates found in each.
Express Entry candidates can reference this table to assess their profile’s competitiveness.
| CRS score range | Number of candidates | Percentage | Percentile range |
|---|---|---|---|
| 0–300 | 8,081 | 3.22% | 0.00% - 3.22% |
| 301–350 | 19,963 | 7.95% | 3.22% - 11.17% |
| 351–400 | 53,066 | 21.14% | 11.17% - 32.32% |
| 401–410 | 13,662 | 5.44% | 32.32% - 37.76% |
| 411–420 | 14,839 | 5.91% | 37.76% - 43.67% |
| 421–430 | 14,820 | 5.90% | 43.67% - 49.58% |
| 431–440 | 16,354 | 6.52% | 49.58% - 56.09% |
| 441–450 | 14,806 | 5.90% | 56.09% - 61.99% |
| 451–460 | 14,924 | 5.95% | 61.99% - 67.94% |
| 461–470 | 15,781 | 6.29% | 67.94% - 74.22% |
| 471–480 | 15,150 | 6.04% | 74.22% - 80.26% |
| 481–490 | 12,473 | 4.97% | 80.26% - 85.23% |
| 491–500 | 12,255 | 4.88% | 85.23% - 90.11% |
| 501–600 | 24,531 | 9.77% | 90.11% - 99.89% |
| 601–1,200 | 288 | 0.11% | 99.89% - 100.00% |
Methodology: The percentiles shown in the table above were determined using the upper limit of each CRS score range and indicate the share of candidates with scores at or below that value.
To aid understanding, percentiles are shown as ranges—showing that Express Entry candidates within each CRS score band fall somewhere between the two percentile values provided.
What draws took place in September?
Over the course of September, the immigration department issued a total of 10,018 Invitations to Apply (ITAs) to Express Entry candidates across five different draw types.
Three of these draws were category-based, including a trades draw, in which 2,500 candidates with at least six months of trades experience in an eligible occupation received an ITA for permanent residence.
| Draw date | Draw type | ITAs issued | CRS cut-off score |
|---|---|---|---|
| September 2, 2025 | Provincial Nominee Program | 249 | 772 |
| September 3, 2025 | Canadian Experience Class | 1,000 | 534 |
| September 4, 2025 | French-language proficiency | 4,500 | 446 |
| September 15, 2025 | Provincial Nominee Program | 228 | 746 |
| September 17, 2025 | Education | 2,500 | 462 |
| September 18, 2025 | Trades | 1,250 | 505 |
| September 29, 2025 | Provincial Nominee Program | 291 | 855 |
In September, Immigration, Refugees and Citizenship Canada (IRCC) conducted
- The 16th and 17th PNP draws of the year;
- The ninth Canadian Experience Class (CEC) draw of the year;
- The fifth French-language proficiency draw of the year;
- The second education draw of the year; and
- The first trades draw of the year.
In September, the IRCC issued 3,601 more invitations through the Express Entry system than it did in August.
September’s 10,018 ITA count significantly outpaces the number of ITAs issued in each of the previous five months.
Overall, it marks the third highest number of ITAs issued per month in 2025.
| Month | Total number of ITAs issued |
|---|---|
| January 2025 | 5,821 |
| February 2025 | 11,601 |
| March 2025 | 13,261 |
| April 2025 | 1,246 |
| May 2025 | 2,511 |
| June 2025 | 7,405 |
| July 2025 | 7,558 |
| August 2025 | 6,417 |
- Do you need Canadian immigration assistance? Contact the Contact Cohen Immigration Law firm by completing our form
- Send us your feedback or your non-legal assistance questions by emailing us at media@canadavisa.com