Number of top-scoring Express Entry profiles dips 10% below previous low
The number of profiles in the Express Entry candidate pool continues its downward trend, easing competition as a net 1,172 profiles exited the pool over the latest two weeks as of March 15 (the latest data available).
The most recent data on the pool's composition, however, does not account for recent draws that issued over 8,000 additional invitations to apply (ITAs) in just three days (March 16-18).
See how competitive your Express Entry profile is
We previously estimated at the start of March that the number of top-scoring profiles (501-600 scoring points) in the Express Entry pool could be as few as 10,000, with the knowledge that a sizeable CEC draw that occurred after the March 1 data was posted was likely to bring the pool composition down even further than reported.
With the newly refreshed March 15 data in mind, in conjunction with draws that occurred after that date, the number of top-scoring candidates in the 501–600 range may now be approaching just 9,000 profiles—a 10% reduction from our previous estimate and a new low for this scoring bracket.
This article examines the latest changes to the pool as of March 15, 2026 (the most recent data), the unaccounted-for Express Entry draws, and their impact on candidates’ chances of receiving an ITA.
What changes occurred in the Express Entry pool over the last two weeks?
Between March 1 and March 15, a net total of 1,172 profiles exited the Express Entry pool.
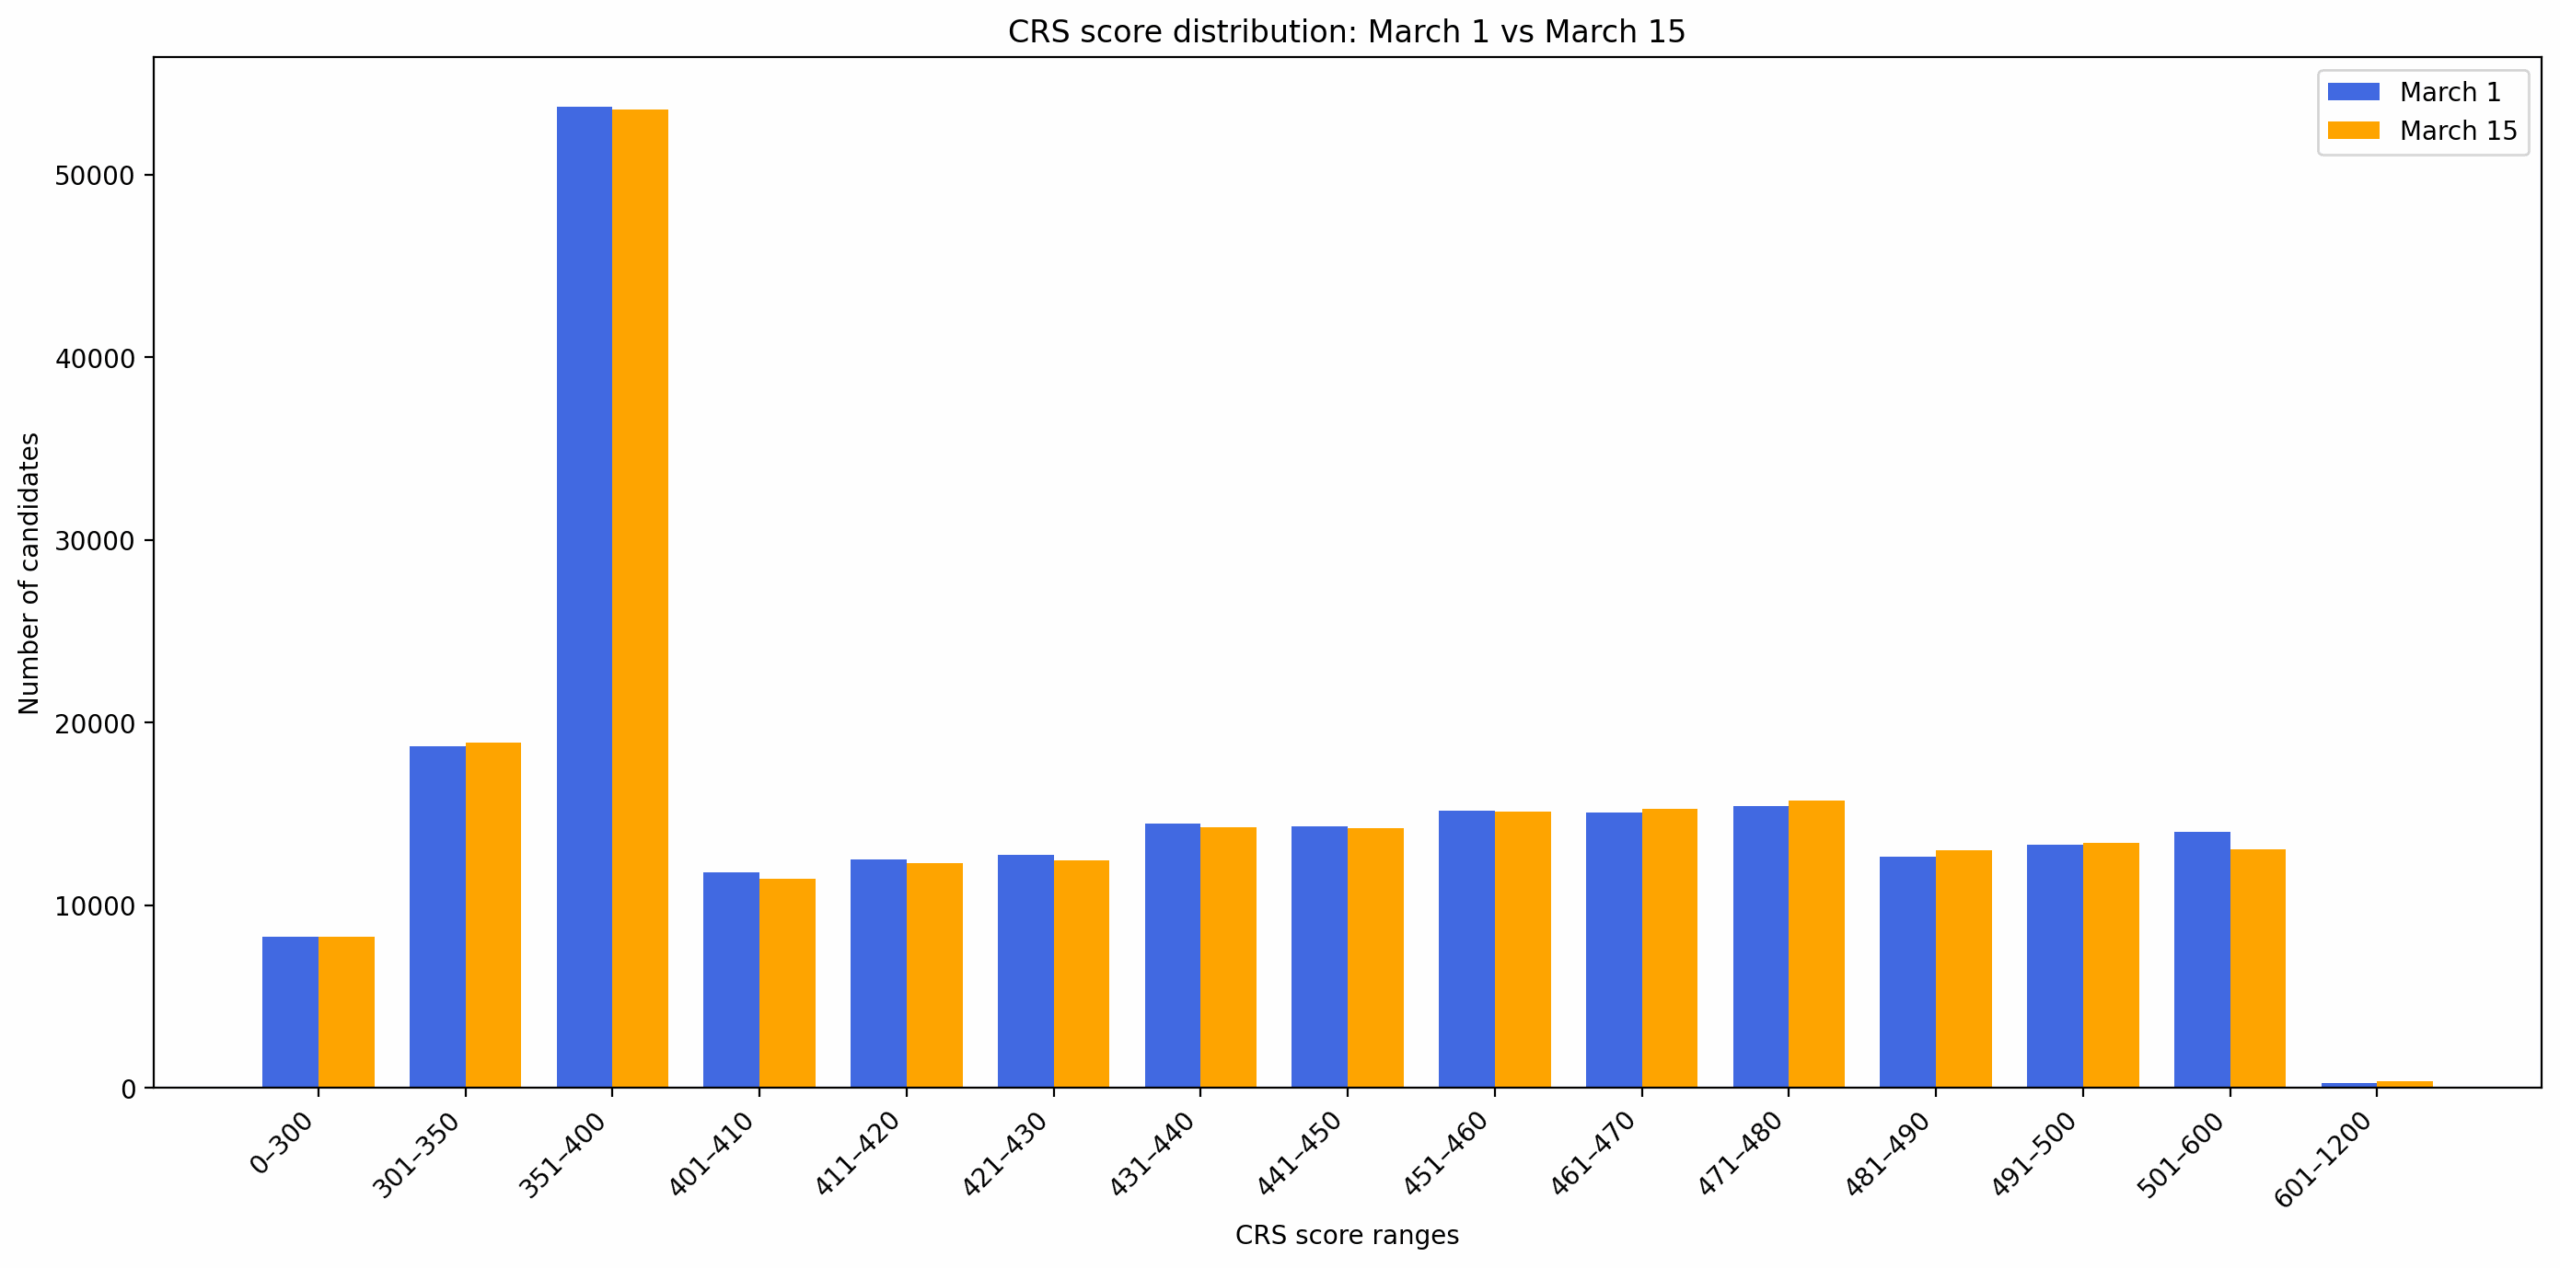
Of these, the largest single decrease came from the 501–600 Comprehensive Ranking System (CRS) score range, which saw a net reduction of 992 profiles.
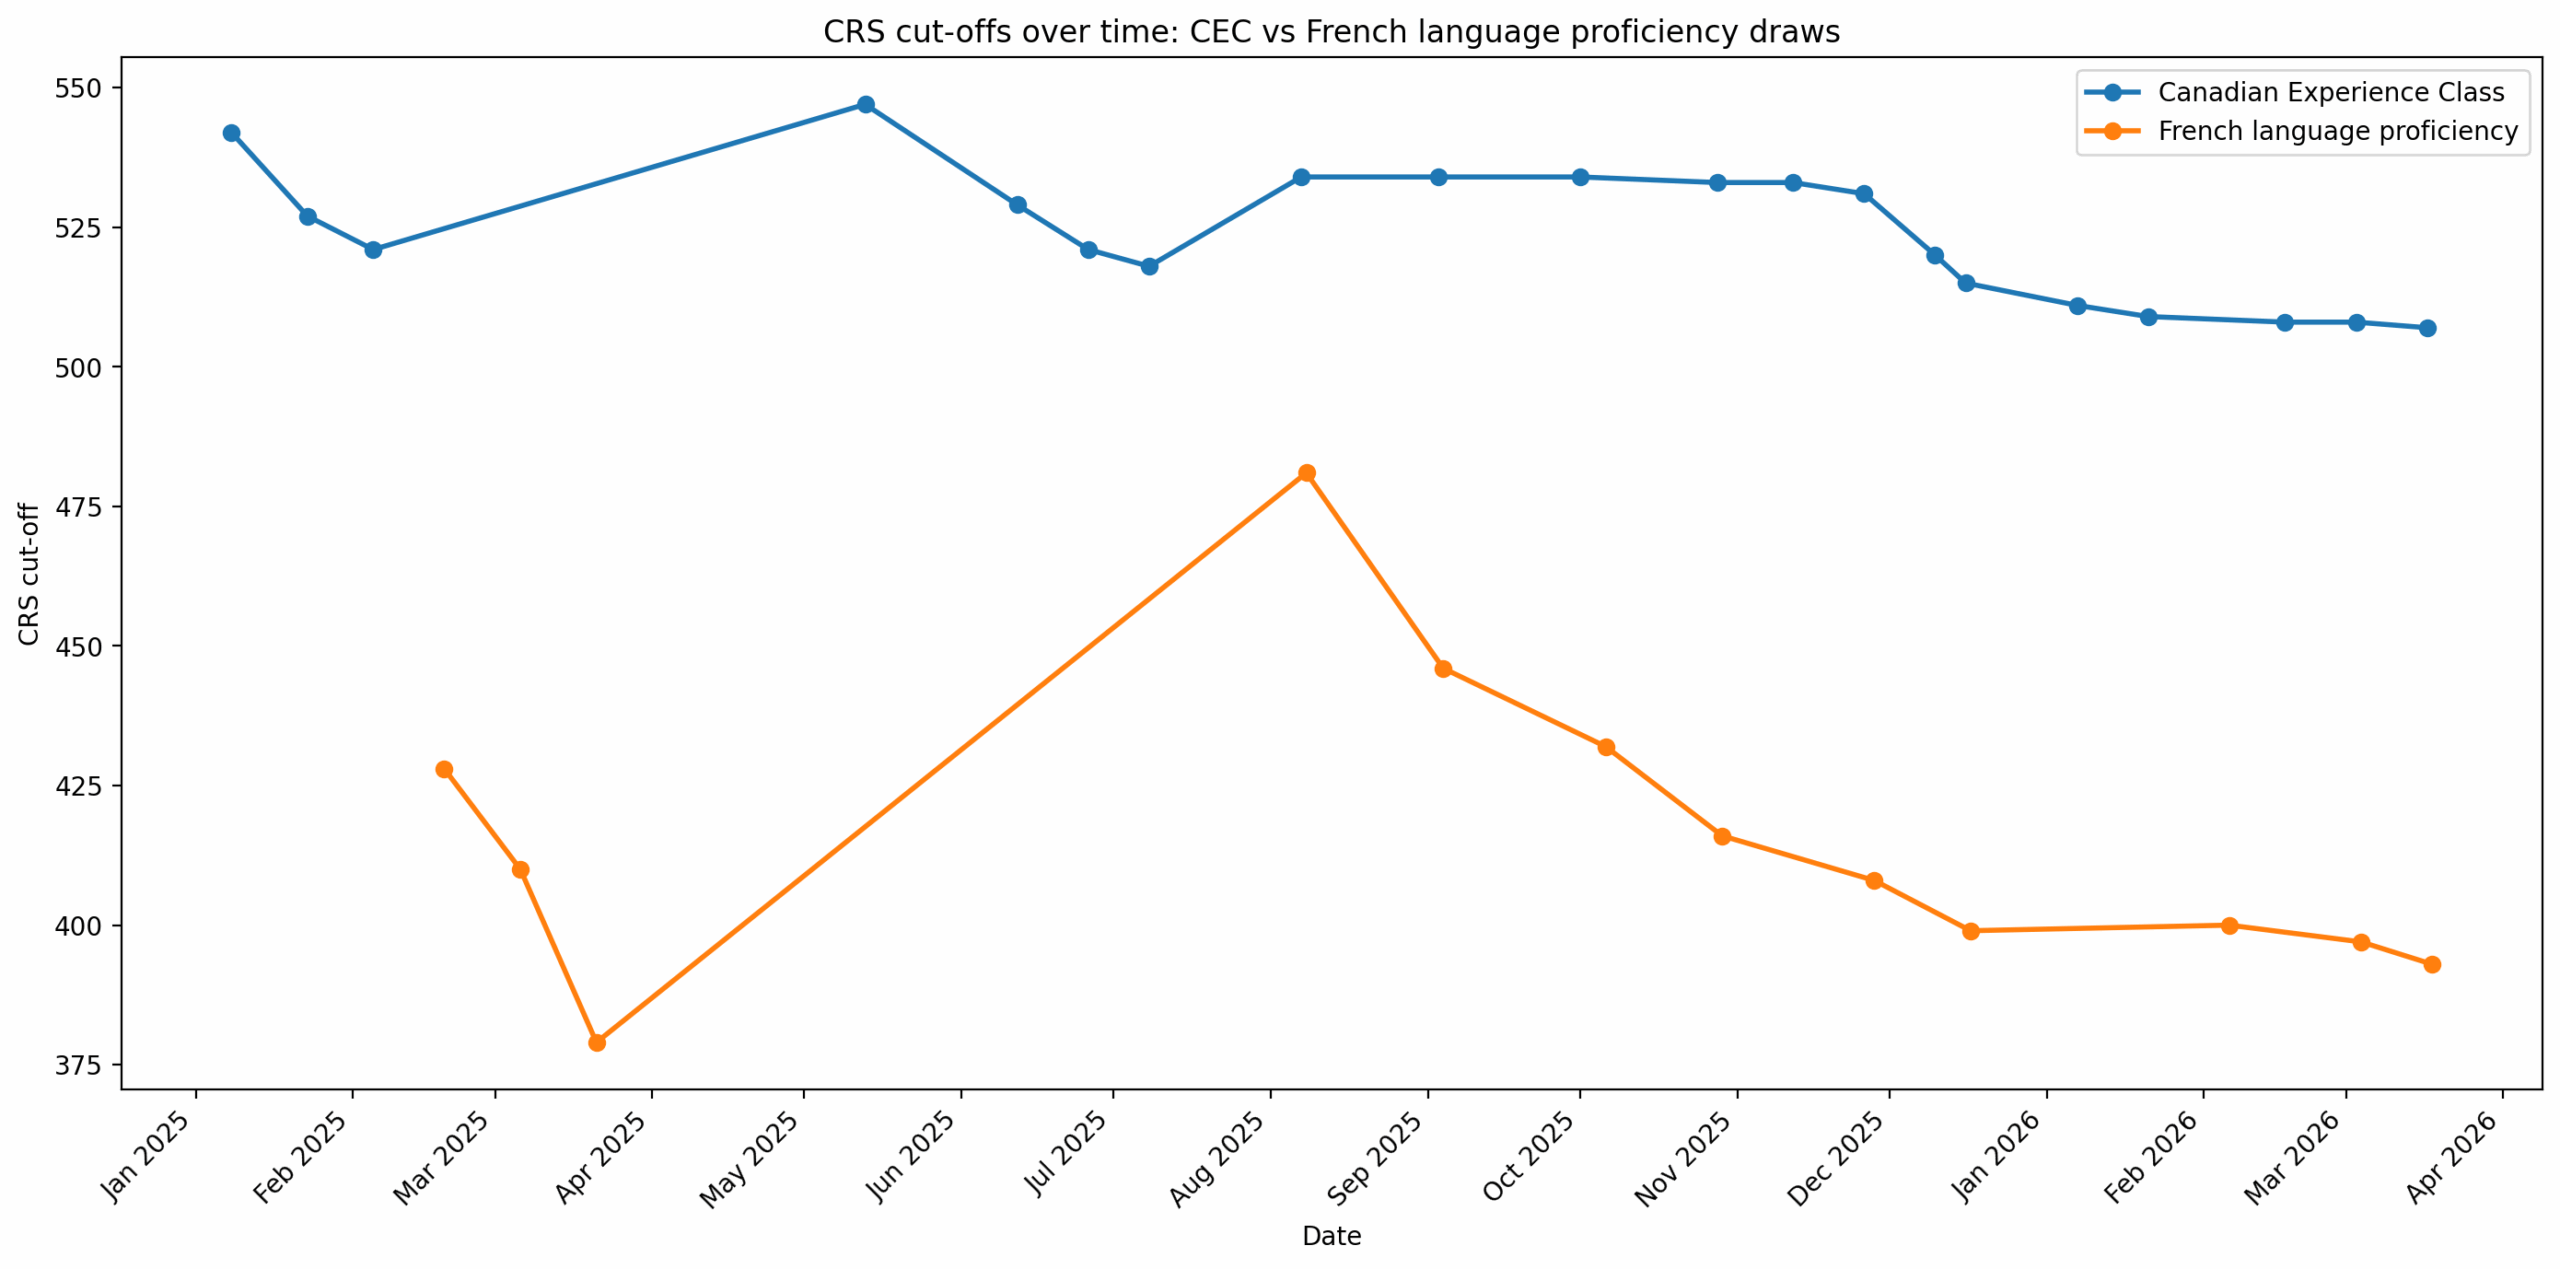
This score range has seen consistent reductions due to regular Canadian Experience Class (CEC) draws, which have issued a cumulative 28,000 invitations since the start of the year.
In addition, within the last two weeks, significant reductions were also seen in the following score ranges (in order of profile reduction):
- The 401–410 range which decreased by 359 profiles;
- The 421–430 range which decreased by 275 profiles; and
- The 431–440 range which decreased by 234 profiles.
Note: The pool composition data published on March 15 does not account for the three Express Entry draws that took place between March 16 and 18, through which a total of 8,362 ITAs were issued. This is discussed in further detail below.
In total, eight score ranges experienced reductions of varying degrees, with the remaining seven gaining profiles:
| CRS score range | March 1 | March 15 | Difference (March 15 – March 1) |
|---|---|---|---|
| 0–300 | 8,276 | 8,299 | +23 |
| 301–350 | 18,694 | 18,903 | +209 |
| 351–400 | 53,727 | 53,565 | -162 |
| 401–410 | 11,796 | 11,437 | -359 |
| 411–420 | 12,511 | 12,288 | -223 |
| 421–430 | 12,746 | 12,471 | -275 |
| 431–440 | 14,481 | 14,247 | -234 |
| 441–450 | 14,334 | 14,195 | -139 |
| 451–460 | 15,167 | 15,122 | -45 |
| 461–470 | 15,099 | 15,272 | +173 |
| 471–480 | 15,415 | 15,751 | +336 |
| 481–490 | 12,678 | 12,992 | +314 |
| 491–500 | 13,321 | 13,421 | +100 |
| 501–600 | 14,031 | 13,039 | -992 |
| 601–1200 | 258 | 360 | +102 |
| Total | 232,534 | 231,362 | -1,172 |
These distributions are compared in the bar chart below for easier visualization:
Which draws have not been accounted for in the March 15 distribution?
As noted, Immigration, Refugees and Citizenship Canada's (IRCC's) latest Express Entry data does not consider the most recent run of draws that occurred between March 16 and 18:
| Date | Round type | Invitations issued | CRS score of lowest-ranked candidate invited |
|---|---|---|---|
| March 18 | French-Language proficiency 2026-Version 2 | 4,000 | 393 |
| March 17 | Canadian Experience Class (CEC) | 4,000 | 507 |
| March 16 | Provincial Nominee Program (PNP) | 362 | 742 |
Based on these invitation results, these draws could correspond to significant changes in the candidate pool composition, to a minimum of:
- 4,000 fewer profiles between the 351–400 score range and above (French-Language proficiency draw);
- 4,000 fewer profiles between the 501–600 score range and above (CEC draw); and
- 362 fewer profiles between the 601–1200 score range (PNP draw).
CEC and French draws have consistently invited large numbers of candidates through their draws, contributing to falling CRS cut-off scores for both draw types:
What accounted for the decrease in Express Entry profiles between March 1 and March 15?
Apart from those who aged out of the pool or withdrew their profiles, most of the reduction in candidates in the Express Entry pool can be attributed to the four Express Entry draws that occurred between March 2 and 5.
These draws cumulatively issued 10,014 ITAs across four different draw types:
| Date | Round type | Invitations issued | CRS score of lowest-ranked candidate invited |
|---|---|---|---|
| March 5 | Senior managers with Canadian work experience | 250 | 429 |
| March 4 | French-Language proficiency | 5,500 | 397 |
| March 3 | Canadian Experience Class | 4,000 | 508 |
| March 2 | Provincial Nominee Program | 264 | 710 |
Notably, since each ITA should correspond to at least one candidate exiting the Express Entry pool, much of the reduction expected from these 10,014 ITAs was offset by new candidate profiles that entered the candidate pool.
A net decrease of only 1,172 profiles, despite a significant sum of ITAs issued, suggests that nearly 8,800 new profiles may have entered the pool during this period.
How competitive is the Express Entry pool now?
The following table breaks down the competitiveness of the Express Entry pool, comparing the percentage of makeup and the percentile scoring of candidates at the edges of each score range.
March 15 data is used to compute these scores:
| CRS score range | Number of candidates | Percentile range | Percentage |
|---|---|---|---|
| 0–300 | 8,299 | 0.00%–3.59% | 3.59% |
| 301–350 | 18,903 | 3.59%–11.76% | 8.17% |
| 351–400 | 53,565 | 11.76%–34.91% | 23.15% |
| 401–410 | 11,437 | 34.91%–39.85% | 4.94% |
| 411–420 | 12,288 | 39.85%–45.16% | 5.31% |
| 421–430 | 12,471 | 45.16%–50.55% | 5.39% |
| 431–440 | 14,247 | 50.55%–56.71% | 6.16% |
| 441–450 | 14,195 | 56.71%–62.85% | 6.14% |
| 451–460 | 15,122 | 62.85%–69.38% | 6.54% |
| 461–470 | 15,272 | 69.38%–75.98% | 6.60% |
| 471–480 | 15,751 | 75.98%–82.79% | 6.81% |
| 481–490 | 12,992 | 82.79%–88.41% | 5.62% |
| 491–500 | 13,421 | 88.41%–94.21% | 5.80% |
| 501–600 | 13,039 | 94.21%–99.84% | 5.64% |
| 601–1200 | 360 | 99.84%–100.00% | 0.16% |
- Do you need Canadian immigration assistance? Contact the Contact Cohen Immigration Law firm by completing our form
- Send us your feedback or your non-legal assistance questions by emailing us at media@canadavisa.com