Express Entry competition continues to ease
Top-scoring profiles in Canada’s Express Entry pool continue to drop to their lowest levels in recent years, as larger, consistent draws help ease overall competition among candidates.
Based on recent pool composition data and the run of draws that have taken place between March 2 and 5, the number of profiles in the 501-600 scoring range may be as low as 10,000, a level not reported since 2024.
See how competitive your Express Entry profile is
This continues the downward trajectory in the number of top-scoring profiles observed on February 15, 2026—during the previous round of Express Entry draws.
This article will delve into these changes in the Express Entry pool over the last two weeks, the potential impact of uncounted draws on the pool composition, and how current candidates stack up against each other.
What changes occurred in the Express Entry pool over the last two weeks?
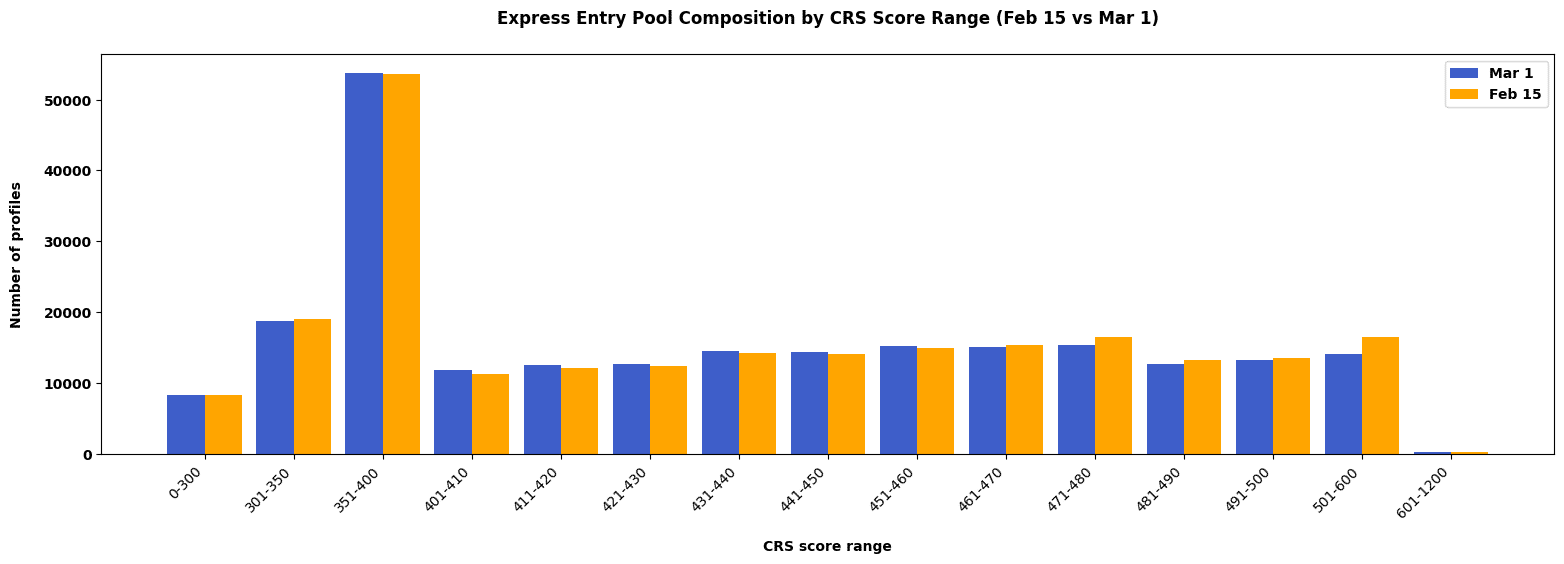
Between February 15 and March 1 (the most recent data available), a net total of 3,161 profiles exited the Express Entry pool. Of these, 80% (2,528) profiles came from the 501-600 score range.
Other notable decreases came from the 471-480 Comprehensive Ranking System (CRS) score range, which saw a net decrease of 1,116 profiles.
In total, seven score ranges experienced reductions of varying degrees, with the remaining eight gaining profiles:
Note: The pool composition data published on March 1 does not account for the Express Entry draws that have taken place between March 2 and 5, issuing more than 10,000 ITAs. This is discussed in further detail below.
| CRS score range | February 15 | March 1 | Difference (March 1 - February 15) |
|---|---|---|---|
| 0–300 | 8,283 | 8,276 | -7 |
| 301–350 | 19,009 | 18,694 | -315 |
| 351–400 | 53,650 | 53,727 | 77 |
| 401–410 | 11,316 | 11,796 | 480 |
| 411–420 | 12,183 | 12,511 | 328 |
| 421–430 | 12,425 | 12,746 | 321 |
| 431–440 | 14,239 | 14,481 | 242 |
| 441–450 | 14,142 | 14,334 | 192 |
| 451–460 | 14,900 | 15,167 | 267 |
| 461–470 | 15,426 | 15,099 | -327 |
| 471–480 | 16,531 | 15,415 | -1,116 |
| 481–490 | 13,248 | 12,678 | -570 |
| 491–500 | 13,504 | 13,321 | -183 |
| 501–600 | 16,559 | 14,031 | -2,528 |
| 601–1200 | 280 | 258 | -22 |
| Total | 235,695 | 232,534 | -3,161 |
The current composition of the Express Entry pool (as of March 1), as compared to the February 15 composition, has also been graphed below for easier visualization:
Which draws have not been accounted for in the March 1 distribution?
As noted, Immigration, Refugees and Citizenship Canada’s (IRCC’s) latest Express Entry data does not consider the most recent run of draws that occurred between March 2 and 5—totalling 10,014 ITAs:
| Date | Round type | Invitations issued | CRS score of lowest-ranked candidate invited |
|---|---|---|---|
| March 5 | Senior Managers with Canadian work experience | 250 | 429 |
| March 4 | French-Language proficiency | 5,500 | 397 |
| March 3 | Canadian Experience Class | 4,000 | 508 |
| March 2 | Provincial Nominee Program | 264 | 710 |
Based on these invitation results, these draws could correspond to significant changes in the candidate pool composition, to a minimum of:
- 5,500 fewer profiles between the 351-400 score range and above;
- 4,000 fewer profiles between the 501-600 score range and above;
- 264 fewer profiles between the 601-1200 score range (effectively inviting the totality of candidates in this group); and
- 250 fewer profiles between the 421-430 score range and above.
See how competitive your Express Entry profile is
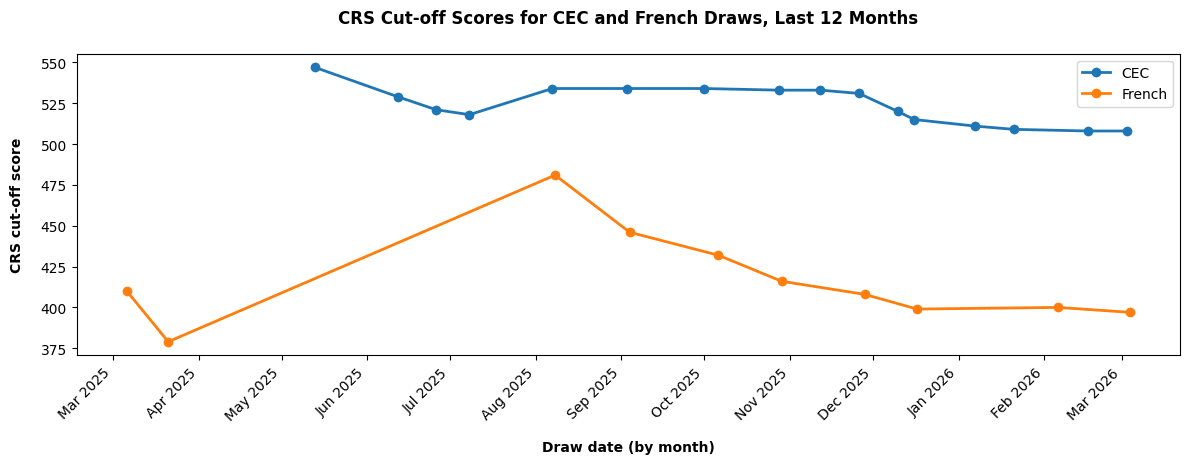
CEC and French draws have consistently invited large numbers of candidates through their draws, contributing to falling CRS cut-off scores for both draw-types:
What accounted for the decrease in Express Entry profiles between February 15 and March 1?
Apart from those who were aged out of the pool or who withdrew their profiles, most of the reduction in candidates in the Express Entry pool can be attributed to the four Express Entry draws that occurred in the last two weeks.
These draws cumulatively issued 10,670 Invitations to Apply (ITAs) across four different draw types, including the first draws for Express Entry’s new Physicians category:
| Date | Round type | Invitations issued | CRS score of lowest-ranked candidate invited |
|---|---|---|---|
| February 20 | Healthcare and Social Services Occupations | 4,000 | 467 |
| February 19 | Physicians with Canadian Work Experience | 391 | 169 |
| February 17 | Canadian Experience Class | 6,000 | 508 |
| February 16 | Provincial Nominee Program | 279 | 789 |
Notably, since each ITA should correspond to at least one candidate exiting the Express Entry pool, much of the reduction expected from these ITAs was offset by new candidate profiles that entered the Expression of Interest (EOI) system.
How competitive is the Express Entry pool now?
The following table breaks down the competitiveness of the Express Entry pool, comparing the percentage makeup and the percentile scoring of candidates at the edges of each score range.
March 1 data is used to compute these scores:
| CRS score range | Number of candidates | Cumulative | Percentile | Percentage |
|---|---|---|---|---|
| 0-300 | 8,276 | 8,276 | 0.00%–3.56% | 3.56% |
| 301-350 | 18,694 | 26,970 | 3.56%–11.60% | 8.04% |
| 351-400 | 53,727 | 80,697 | 11.60%–34.70% | 23.11% |
| 401-410 | 11,796 | 92,493 | 34.70%–39.78% | 5.07% |
| 411-420 | 12,511 | 105,004 | 39.78%–45.16% | 5.38% |
| 421-430 | 12,746 | 117,750 | 45.16%–50.64% | 5.48% |
| 431-440 | 14,481 | 132,231 | 50.64%–56.87% | 6.23% |
| 441-450 | 14,334 | 146,565 | 56.87%–63.03% | 6.16% |
| 451-460 | 15,167 | 161,732 | 63.03%–69.55% | 6.52% |
| 461-470 | 15,099 | 176,831 | 69.55%–76.05% | 6.49% |
| 471-480 | 15,415 | 192,246 | 76.05%–82.67% | 6.63% |
| 481-490 | 12,678 | 204,924 | 82.67%–88.13% | 5.45% |
| 491-500 | 13,321 | 218,245 | 88.13%–93.86% | 5.73% |
| 501-600 | 14,031 | 232,276 | 93.86%–99.89% | 6.03% |
| 601-1200 | 258 | 232,534 | 99.89%–100.00% | 0.11% |
The percentile figures in the table represent the share of Express Entry candidates whose CRS scores are at or below the upper bound of each score range.
To make the results easier to interpret, the percentiles are displayed as ranges, meaning candidates within a given CRS bracket fall between the two percentile values shown.
- Do you need Canadian immigration assistance? Contact the Contact Cohen Immigration Law firm by completing our form
- Send us your feedback or your non-legal assistance questions by emailing us at media@canadavisa.com