
93% of Express Entry pool growth driven by candidates scoring in the 501–600 range

Profiles in the 501–600 Comprehensive Ranking System (CRS) score range are being added to Canada’s Express Entry candidate pool at a rate that far exceeds any other group of candidates.
Canada’s Express Entry pool grew by 4,395 profiles between April 26 and May 24, with the 501-600 CRS score range alone adding 4,085 profiles, 93% of the pool’s net expansion—a testament to how competitive the pool has gotten in recent months.
See how competitive your Express Entry profile is
This surge was driven in large part by Immigration, Refugees and Citizenship Canada’s (IRCC’s) 29-day pause in Canadian Experience Class (CEC) draws—the longest period without a CEC draw in 2026.
During that window, high-scoring candidates continued to enter the pool while none were removed through CEC-specific invitations, causing the 501–600 range to swell from 13,860 to 17,945 profiles.
When CEC draws resumed on May 27, the impact of that accumulation was immediate: IRCC issued 3,000 Invitations to Apply (ITAs) at a CRS cut-off of 518—the highest CEC cut-off of 2026—with a tie-breaking date of April 30, 2025.
What changes occurred in the Express Entry pool over the last four weeks?
Between April 26 and May 24, the Express Entry pool grew from 234,452 to 238,847 profiles—a net increase of 4,395.
During this period, the 501–600 CRS score range grew by 29%, swelling to 7.51% of the total Express Entry candidate pool.
Beyond the 501–600 range, several other brackets saw growth, including the 461–500 bands, which also grew broadly:
- The 471–480 range gained 553 profiles;
- The 481–490 range gained 508 profiles; and
- 461–470 gained 289 profiles.
These upper-mid bands have been consistently absorbing new candidates over recent reporting periods.
The lower end of the pool, by contrast, contracted:
- The 401–420 bands lost a combined 957 profiles (with the 411–420 range shedding the most at 554);
- The 351–400 range declined by 293 profiles; and
- The 301–350 score range lost 358 profiles.
These decreases are consistent with French-language proficiency draws pulling candidates from these bands.
Note: The pool composition data published on May 24 does not account for the three Express Entry draws that took place between May 25 and 28, through which a total of 7,834 ITAs were issued. This is discussed in further detail below.
In total, eight score ranges gained profiles, while seven experienced declines:
| CRS score range | April 26 | May 24 | Difference (May 24 – April 26) |
|---|---|---|---|
| 0–300 | 8,339 | 8,303 | -36 |
| 301–350 | 18,733 | 18,375 | -358 |
| 351–400 | 52,874 | 52,581 | -293 |
| 401–410 | 12,185 | 11,782 | -403 |
| 411–420 | 12,956 | 12,402 | -554 |
| 421–430 | 12,613 | 12,915 | +302 |
| 431–440 | 14,456 | 14,401 | -55 |
| 441–450 | 14,305 | 14,463 | +158 |
| 451–460 | 15,175 | 15,274 | +99 |
| 461–470 | 15,973 | 16,262 | +289 |
| 471–480 | 16,487 | 17,040 | +553 |
| 481–490 | 12,815 | 13,323 | +508 |
| 491–500 | 13,209 | 13,449 | +240 |
| 501–600 | 13,860 | 17,945 | +4,085 |
| 601–1200 | 472 | 332 | -140 |
| Total | 234,452 | 238,847 | +4,395 |
These distributions are compared in the chart below for easier visualization:
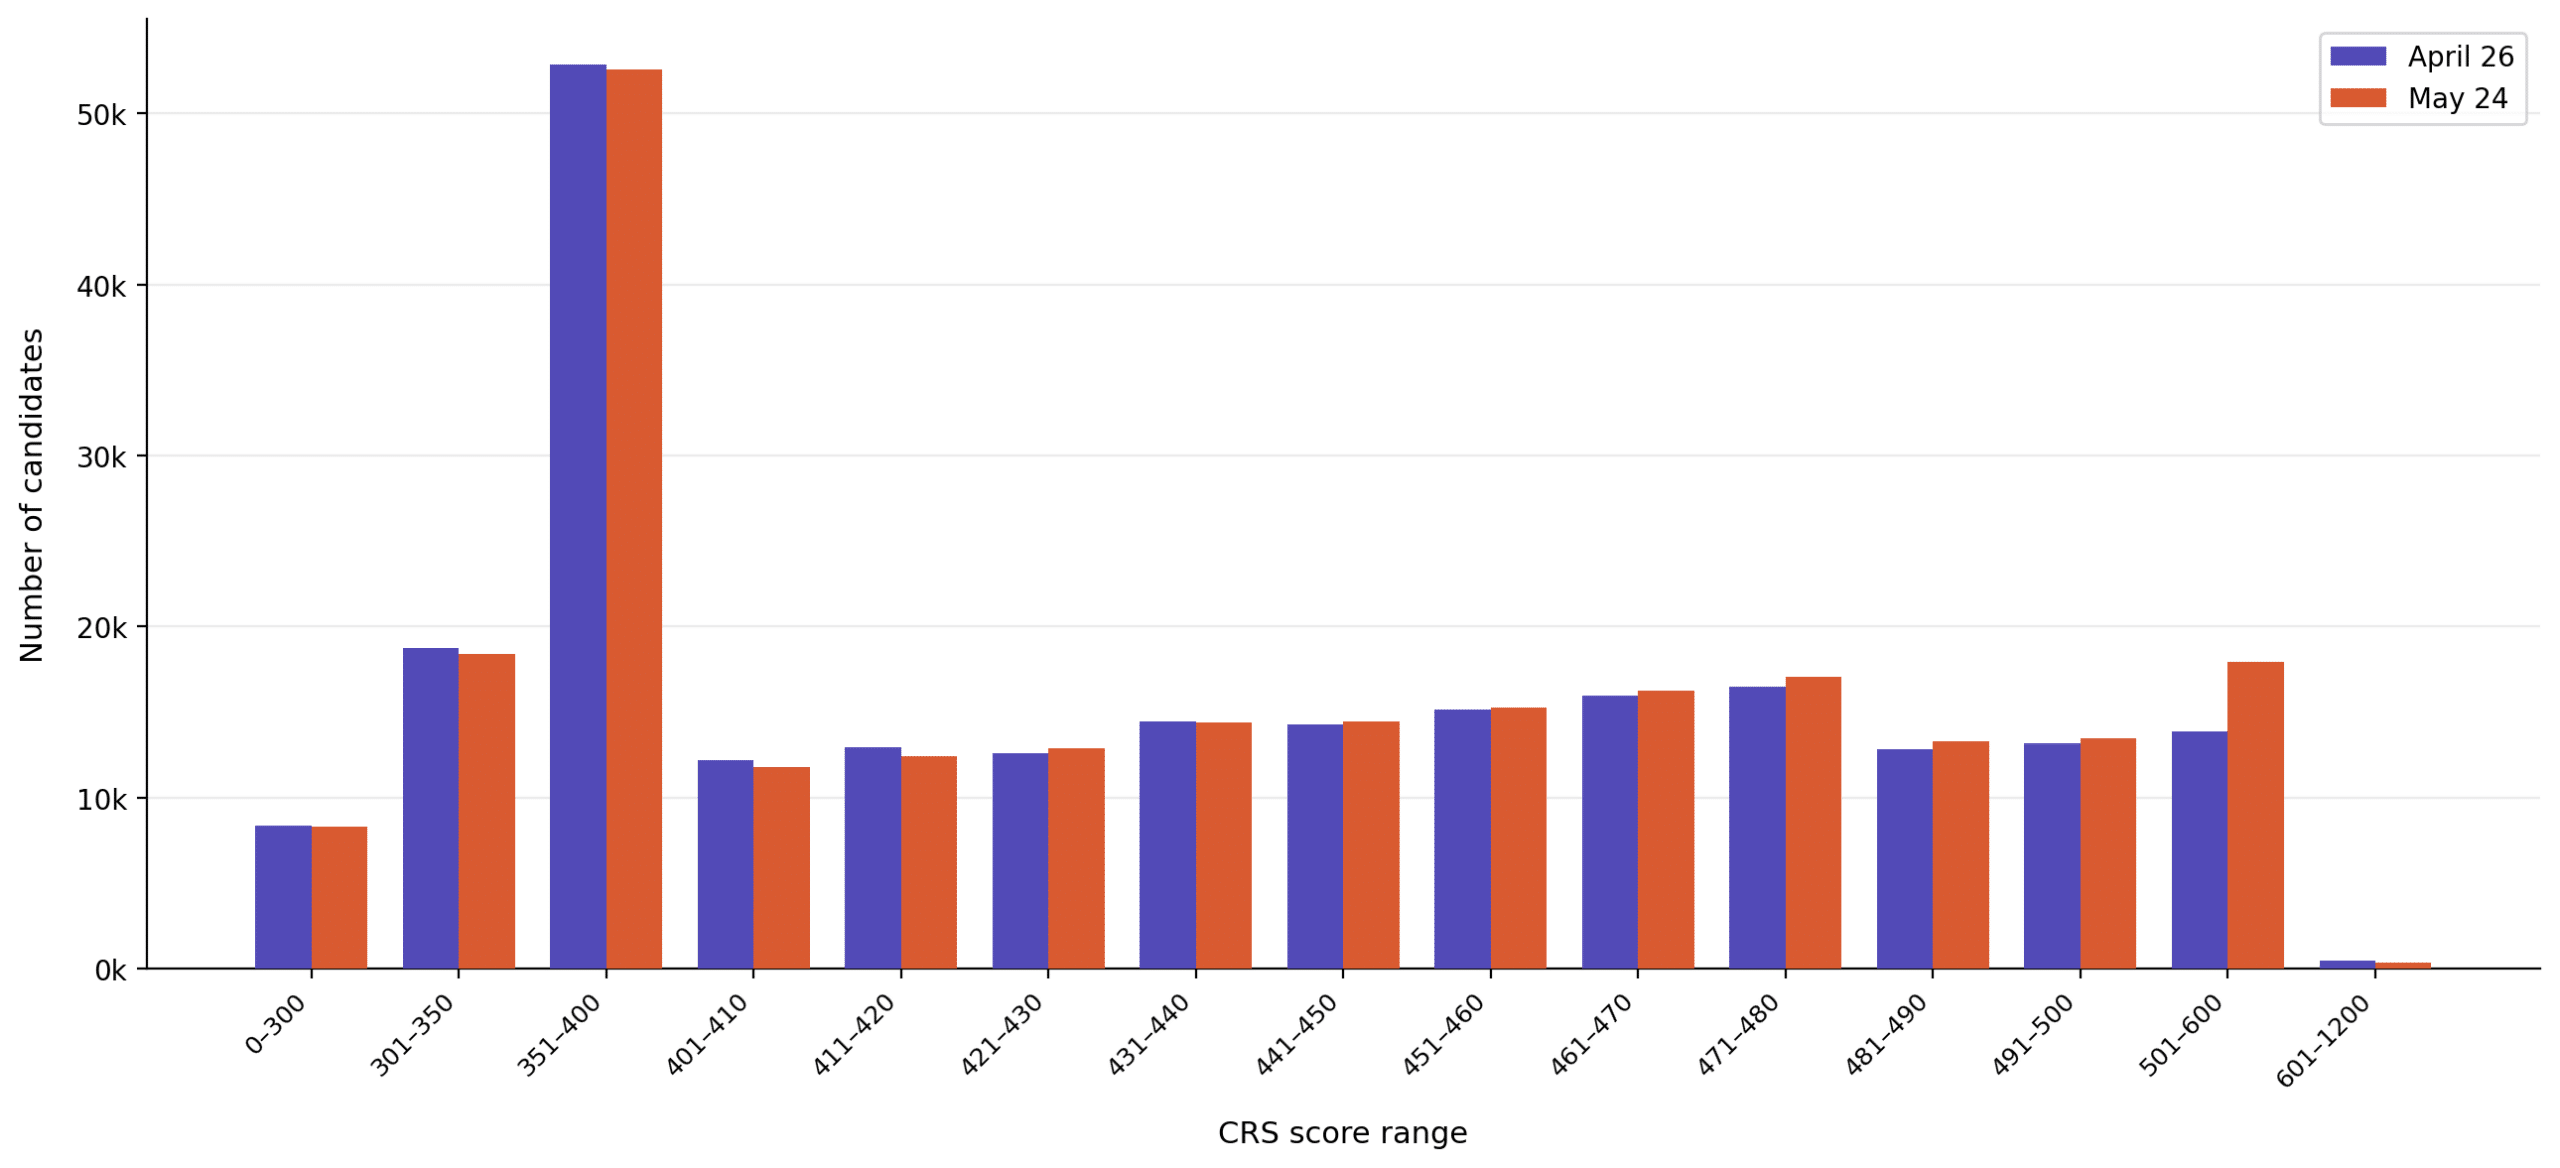
A bar chart showing the comparison in the composition of the Express Entry pool between April 26 and May 24
Which draws have not been accounted for in the May 24 distribution?
IRCC’s latest Express Entry data does not consider the three draws that occurred between May 25 and 28—totalling 7,834 ITAs:
| Date | Round type | Invitations issued | CRS score of lowest-ranked candidate invited |
|---|---|---|---|
| May 28 | French-Language proficiency | 4,500 | 409 |
| May 27 | Canadian Experience Class | 3,000 | 518 |
| May 25 | Provincial Nominee Program | 334 | 805 |
Based on these invitation results, these draws could correspond to significant changes in the candidate pool composition, to a minimum of:
- 4,500 fewer profiles between the 401–410 score range and above (French-Language proficiency draw at CRS 409);
- 3,000 fewer profiles between the 501–600 score range and above (CEC draw at CRS 518); and
- 334 fewer profiles between the 601–1200 score range (PNP draw at CRS 805).
This confirms the pattern flagged in previous coverage of the Express Entry pool composition: the 501–600 range has been accumulating candidates faster than CEC draws can deplete them. Even a 50% increase in draw size (as compared to the April 28 draw) was not enough to lower the cut-off.
What accounted for the changes in Express Entry profiles between April 26 and May 24?
IRCC held four draws between April 26 and May 24, with a combined total of 6,853 invitations issued:
| Date | Round type | Invitations issued | CRS score of lowest-ranked candidate invited |
|---|---|---|---|
| May 11 | Provincial Nominee Program | 380 | 798 |
| April 29 | French-Language proficiency | 4,000 | 400 |
| April 28 | Canadian Experience Class | 2,000 | 514 |
| April 27 | Provincial Nominee Program | 473 | 795 |
Despite 6,853 ITAs being issued, the pool grew by 4,395 profiles. This indicates that approximately 11,248 new profiles entered the pool over the four weeks—a substantial increase in intake that outpaced the rate at which candidates were being removed.
How competitive is the Express Entry pool now?
The following table breaks down the competitiveness of the Express Entry pool, comparing the percentage makeup and the percentile scoring of candidates at the edges of each score range.
May 24 data is used to compute these scores:
| CRS score range | Number of candidates | Cumulative | Percentile range | Percentage |
|---|---|---|---|---|
| 0–300 | 8,303 | 8,303 | 0.00%–3.48% | 3.48% |
| 301–350 | 18,375 | 26,678 | 3.48%–11.17% | 7.69% |
| 351–400 | 52,581 | 79,259 | 11.17%–33.18% | 22.01% |
| 401–410 | 11,782 | 91,041 | 33.18%–38.12% | 4.93% |
| 411–420 | 12,402 | 103,443 | 38.12%–43.31% | 5.19% |
| 421–430 | 12,915 | 116,358 | 43.31%–48.72% | 5.41% |
| 431–440 | 14,401 | 130,759 | 48.72%–54.75% | 6.03% |
| 441–450 | 14,463 | 145,222 | 54.75%–60.80% | 6.06% |
| 451–460 | 15,274 | 160,496 | 60.80%–67.20% | 6.39% |
| 461–470 | 16,262 | 176,758 | 67.20%–74.00% | 6.81% |
| 471–480 | 17,040 | 193,798 | 74.00%–81.14% | 7.13% |
| 481–490 | 13,323 | 207,121 | 81.14%–86.72% | 5.58% |
| 491–500 | 13,449 | 220,570 | 86.72%–92.35% | 5.63% |
| 501–600 | 17,945 | 238,515 | 92.35%–99.86% | 7.51% |
| 601–1200 | 332 | 238,847 | 99.86%–100.00% | 0.14% |
The percentile figures in the table represent the share of Express Entry candidates whose CRS scores are at or below the upper bound of each score range.
To make the results easier to interpret, the percentiles are displayed as ranges, meaning candidates within a given CRS bracket fall between the two percentile values shown.
- Do you need Canadian immigration assistance? Contact the Contact Cohen Immigration Law firm by completing our form
- Send us your feedback or your non-legal assistance questions by emailing us at media@canadavisa.com