
Express Entry pool gets more top heavy

From May 24 to June 21, the number of top-scoring Express Entry profiles grew at a rate 4,400% faster than the overall pool.
The overall Express Entry pool grew by 0.33%, while the number of candidates scoring 501 or higher increased by 14.64%.
See how competitive your Express Entry profile is
The 501–1,200 range accounted for 74.4% of all profile gains among score bands that expanded.
Around 10% of Express Entry profiles fall within the top-scoring band, while a typical Canadian Experience Class draw will issue invitations only to the top 1-2% of profiles.
What changes occurred in the Express Entry pool over the four-week period?
Between May 24 and June 21, the Express Entry pool grew from 238,847 to 239,645—a net increase of just 798.
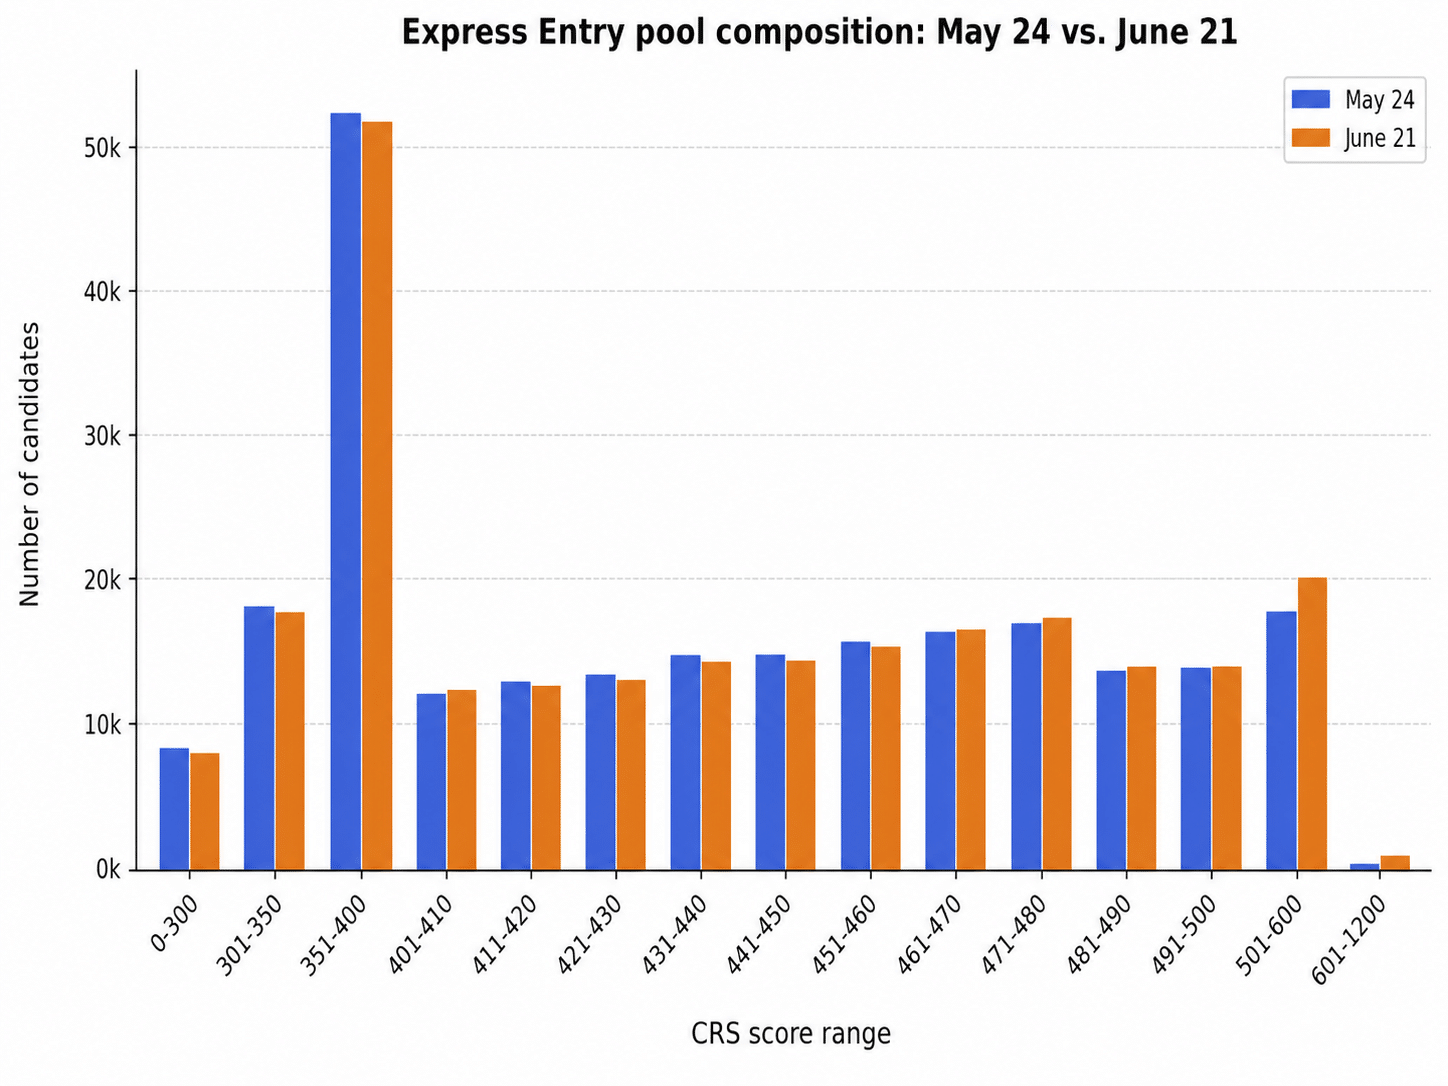
Growth was most pronounced in the 501–600 Comprehensive Ranking System (CRS) score range, where the number of candidates rose by approximately 11.52%. This bracket accounted for 8.35% of the total Express Entry pool.
Here are the top three brackets that experienced growth beyond the 501–600 range:
- The 601–1,200 range gained 609 profiles;
- The 471–480 range gained 278 profiles; and
- The 481–490 range gained 275 profiles.
The growth in the 601–1,200 range between May 24–June 21 represents a reversal compared to April 26–May 24 data, which instead saw this score range drop from 472 to 332 candidates.
The other two ranges that saw the highest growth reflect the ongoing pattern of candidate accumulation in the upper-mid CRS bands across recent reporting periods.
On the other hand, the pool contracted considerably in several score band ranges:
- The 0–400 bands lost a combined total of 1,312 profiles—684 from the 351–400 range alone; and
- The 411–460 bands lost a combined total of 1,489 profiles—with the greatest loss (-421 profiles) coming from the 431–440 range.
For the decreases in the 0–400 bands seen between May 24 and June 21, these were not influenced by draw activity, as the CRS cut-off of the lowest draw during that time was 409. Those lower-band decreases likely came from other pool movements: expirations, withdrawals, ineligibility, or candidates increasing their scores and moving into higher ranges.
Note: the June 21 pool composition data does not account for the draws that took place between June 22–June 23.
In total, seven score ranges saw growth, while eight experienced dips:
| CRS score range | May 24 | June 21 | Difference |
|---|---|---|---|
| 0–300 | 8,303 | 8,104 | -199 |
| 301–350 | 18,375 | 17,946 | -429 |
| 351–400 | 52,581 | 51,897 | -684 |
| 401–410 | 11,782 | 11,968 | +186 |
| 411–420 | 12,402 | 12,128 | -274 |
| 421–430 | 12,915 | 12,584 | -331 |
| 431–440 | 14,401 | 13,980 | -421 |
| 441–450 | 14,463 | 14,147 | -316 |
| 451–460 | 15,274 | 15,127 | -147 |
| 461–470 | 16,262 | 16,358 | +96 |
| 471–480 | 17,040 | 17,318 | +278 |
| 481–490 | 13,323 | 13,598 | +275 |
| 491–500 | 13,449 | 13,537 | +88 |
| 501–600 | 17,945 | 20,012 | +2,067 |
| 601–1,200 | 332 | 941 | +609 |
| Total | 238,847 | 239,645 | +798 |
These distributions are compared in the chart below for easier visualization:
What accounted for the changes in Express Entry profiles between May 24 and June 21?
IRCC conducted three draws between May 24 and June 21, inviting a combined total of 7,834 candidates.
| Date of draw | Round type | Invitations issued | CRS score of lowest-ranked candidate invited |
|---|---|---|---|
| May 25 | Provincial Nominee Program | 334 | 805 |
| May 27 | Canadian Experience Class | 3,000 | 518 |
| May 28 | French-Language proficiency | 4,500 | 409 |
Despite 7,834 invitations to apply being issued over that time, the pool grew by 798 profiles.
Factors contributing to the growth of the pool include new profiles being created, aged-out profiles being reactivated, or invalid profiles becoming valid due to changes.
Factors contributing to the shrinkage of the pool, aside from invitations, include profiles expiring, profiles being withdrawn, or profiles becoming invalid due to a change affecting the primary applicant’s eligibility.
How competitive is the Express Entry pool as of the latest data?
The table below breaks down the competitiveness of the Express Entry pool, comparing the percentage of candidates in each score range and the percentile ranges at the boundaries of those ranges.
The calculations are based on data from June 21.
| CRS score range | Number of candidates | Cumulative | Percentile range | Percentage |
|---|---|---|---|---|
| 0–300 | 8,104 | 8,104 | 0.00%–3.38% | 3.38% |
| 301–350 | 17,946 | 26,050 | 3.38%–10.87% | 7.49% |
| 351–400 | 51,897 | 77,947 | 10.87%–32.53% | 21.66% |
| 401–410 | 11,968 | 89,915 | 32.53%–37.52% | 4.99% |
| 411–420 | 12,128 | 102,043 | 37.52%–42.58% | 5.06% |
| 421–430 | 12,584 | 114,627 | 42.58%–47.83% | 5.25% |
| 431–440 | 13,980 | 128,607 | 47.83%–53.67% | 5.83% |
| 441–450 | 14,147 | 142,754 | 53.67%–59.57% | 5.90% |
| 451–460 | 15,127 | 157,881 | 59.57%–65.88% | 6.31% |
| 461–470 | 16,358 | 174,239 | 65.88%–72.71% | 6.83% |
| 471–480 | 17,318 | 191,557 | 72.71%–79.93% | 7.23% |
| 481–490 | 13,598 | 205,155 | 79.93%–85.61% | 5.67% |
| 491–500 | 13,537 | 218,692 | 85.61%–91.26% | 5.65% |
| 501–600 | 20,012 | 238,704 | 91.26%–99.61% | 8.35% |
| 601–1,200 | 941 | 239,645 | 99.61%–100.00% | 0.39% |
The percentile figures represent how many candidates in the Express Entry pool have CRS scores at or below the upper limit of each score range.
For clarity, the percentiles are displayed as ranges, as candidates within any given CRS bracket may fall between the two values shown.
Which draws have not been accounted for in the June 21 distribution?
The immigration department’s latest Express Entry data does not consider the two draws that occurred after June 21:
| Date of draw | Round type | Invitations issued | CRS score of lowest-ranked candidate invited |
|---|---|---|---|
| June 23 | Canadian Experience Class | 4,000 | 515 |
| June 22 | Provincial Nominee Program | 955 | 730 |

- Do you need Canadian immigration assistance? Contact the Contact Cohen Immigration Law firm by completing our form
- Send us your feedback or your non-legal assistance questions by emailing us at media@canadavisa.com