
July 2025: State of the Express Entry pool

In June, Canada issued more invitations to apply for permanent residency than it did in April and May combined.
In June, there were 7,405 Invitations to Apply (ITAs) issued to Express Entry candidates over six draws—the highest number of draws per month in 2025 to date.
See how competitive your Express Entry profile is
This article will cover
- The draws that took place in June;
- The distribution of scores within the pool; and
- How your Comprehensive Ranking system (CRS) score ranks against other candidates in the pool.
What draws took place in June?
The month of June saw an uptick in Express Entry draws, with the immigration department exceeding last month’s count by two draws.
Immigration, Refugees and Citizenship Canada (IRCC) conducted a total of six draws, inviting candidates through the following draw types:
- The Provincial Nominee Program (PNP);
- The Canadian Experience Class (CEC); and
- Healthcare and social services occupations (category-based selection).
The immigration department announced earlier this year that the healthcare and social services occupations category would be one of its Express Entry priority categories—and this is reflected in its choice of draw types.
The number of ITAs issued in June through each draw type and the corresponding CRS cut-off scores can be viewed in the table below.
| Date of draw | Draw type | Number of ITAs issued | CRS cut-off score |
|---|---|---|---|
| June 2, 2025 | Provincial Nominee Program | 277 | 726 |
| June 4, 2025 | Healthcare and social services occupations | 500 | 504 |
| June 10, 2025 | Provincial Nominee Program | 125 | 784 |
| June 12, 2025 | Canadian Experience Class | 3,000 | 529 |
| June 23, 2025 | Provincial Nominee Program | 503 | 742 |
| June 26, 2026 | Canadian Experience Class | 3,000 | 521 |
The federal government hasn’t held six draws in a month since November of 2024.
While the number of ITAs issued in June surpassed issuances from the two preceding months, it remained significantly lower than February and March totals—aligning more closely with January’s levels.
| Month | Number of ITAs issued |
|---|---|
| January, 2025 | 5,821 |
| February, 2025 | 11,601 |
| March, 2025 | 13,261 |
| April, 2025 | 1,246 |
| May, 2025 | 2,511 |
| June, 2025 | 7,405 |
Thus far in 2025, the immigration department has issued 41,845 invitations through the Express Entry system.
What is the current distribution of scores in the Express Entry pool?
The table and chart below break down the number of candidates within each score range as of June 22, 2025.
| CRS score range | Number of candidates |
|---|---|
| 0-300 | 8,370 |
| 301-350 | 21,746 |
| 351-400 | 54,237 |
| 401-410 | 13,150 |
| 411-420 | 14,209 |
| 421-430 | 14,273 |
| 431-440 | 15,676 |
| 441-450 | 14,927 |
| 451-460 | 15,525 |
| 461-470 | 17,167 |
| 471-480 | 17,358 |
| 481-490 | 13,508 |
| 491-500 | 13,190 |
| 501-600 | 22,947 |
| 601-1200 | 471 |
| Total | 256,754 |
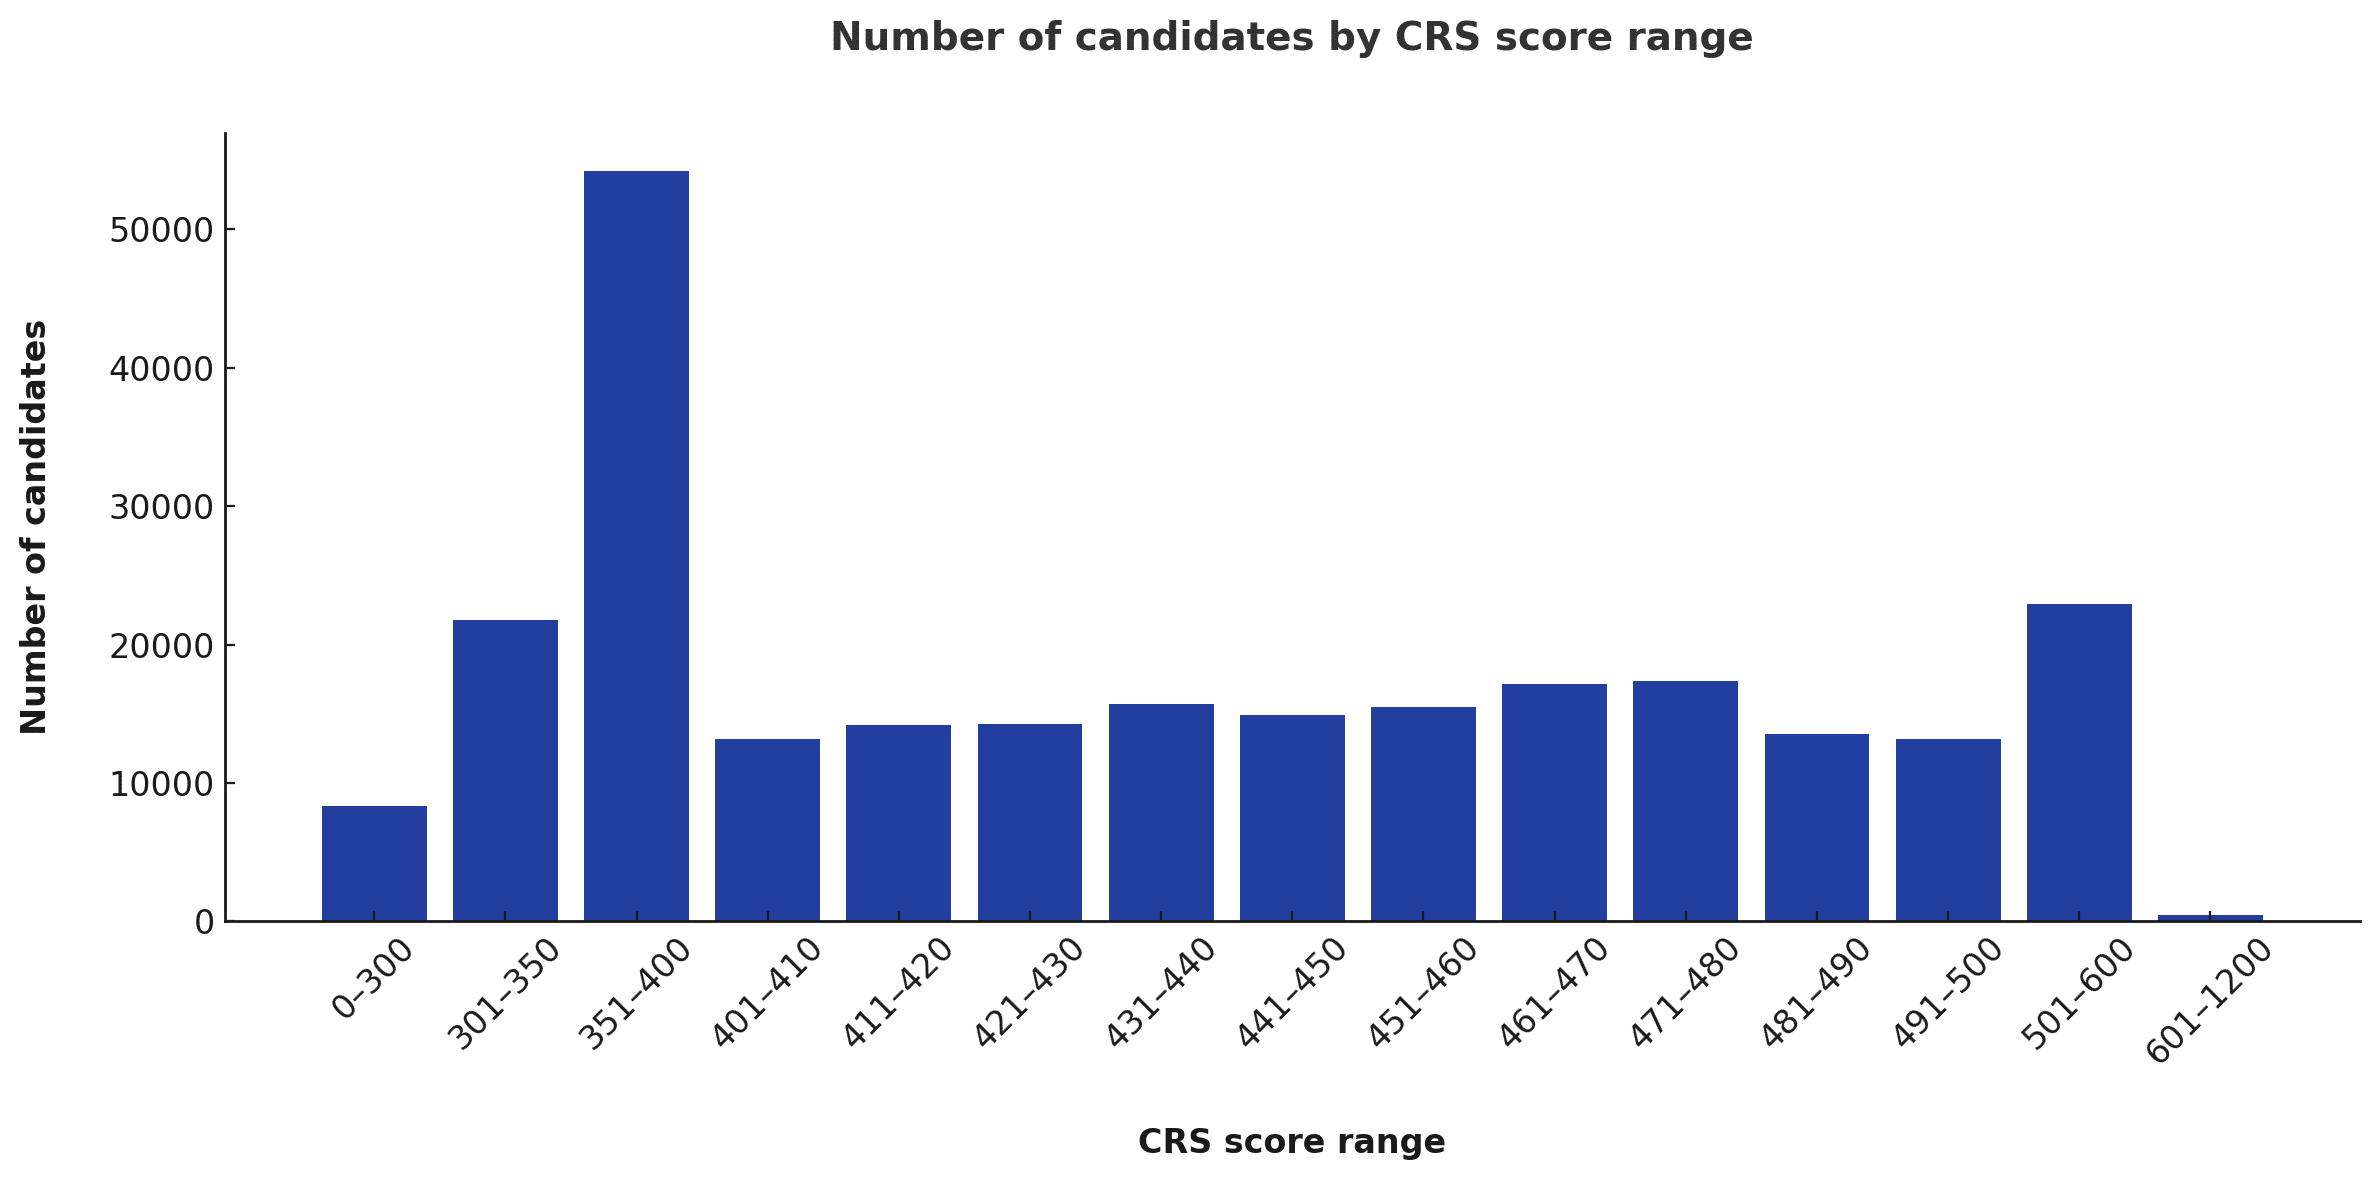
Overall, there are 6,672 more candidate profiles in the pool as of June 22, when compared to May 13 (last available data).
Of note, the number of candidate profiles in the 601-1200 CRS score range has increased by over 440 since May 13.
How do scores in the Express Entry pool rank against each other?
The table below outlines the current distribution of CRS scores within the Express Entry pool as of June 22, 2025. It features the percentile ranges for each score boundary and the proportion of candidates within each score range (relative to the total pool).
Candidates in the Express Entry pool can utilize this table to better understand how competitive their scores are compared to other candidates within the pool.
| CRS score range | Number of Candidates | Percentile range | Percentage |
|---|---|---|---|
| 0-300 | 8,370 | 0 - 3.26% | 3.26% |
| 301-350 | 21,746 | 3.26% - 11.73% | 8.47% |
| 351-400 | 54,237 | 11.73% - 32.85% | 21.12% |
| 401-410 | 13,150 | 32.85% - 37.98% | 5.12% |
| 411-420 | 14,209 | 37.98% - 43.51% | 5.53% |
| 421-430 | 14,273 | 43.51% - 49.07% | 5.56% |
| 431-440 | 15,676 | 49.07% - 55.17% | 6.11% |
| 441-450 | 14,927 | 55.17% - 60.99% | 5.81% |
| 451-460 | 15,525 | 60.99% - 67.03% | 6.05% |
| 461-470 | 17,167 | 67.03% - 73.72% | 6.69% |
| 471-480 | 17,358 | 73.72% - 80.48% | 6.76% |
| 481-490 | 13,508 | 80.48% - 85.74% | 5.26% |
| 491-500 | 13,190 | 85.74% - 90.88% | 5.14% |
| 501-600 | 22,947 | 90.88% - 99.82% | 8.94% |
| 601-1200 | 471 | 99.82% - 100.00% | 0.18% |
Methodology: Percentile scores in the table above were calculated for the upper boundaries of each CRS score range and show the percentage of candidates who have a score either at or below that level.
To increase comprehension, percentiles are shown as ranges—indicating that candidates within each CRS score band fall somewhere between the two percentile values listed.

- Do you need Canadian immigration assistance? Contact the Contact Cohen Immigration Law firm by completing our form
- Send us your feedback or your non-legal assistance questions by emailing us at media@canadavisa.com